


1. Background
As more road tunnels are built, the exposure to exhaust and wear-generated particles could decrease for the vast majority of people, but increase for car users who travel in the road tunnels. Commuters and other road users are directly exposed to traffic-related emissions, with the only protection being the filters in the vehicles and the vehicle itself. As road users spend an increasing amount travel time in tunnels, the exposure time for tunnel air also increases.
The purpose of the study has been to quantify levels of NOx and black carbon (BC) particles inside vehicle cabins in relation to the outside concentrations while traveling through the tunnel Södra länken in Stockholm. The intention was also to generalize the results in order to estimate what exposure road users are exposed to in tunnels and how much this differs between brands and vehicle types.
1.1 Earlier studies
The concentration of air pollutants in road tunnels depends on traffic intensity, driving conditions (speeds, congestions, etc.), vehicle composition, tunnel inclination, entrances, exits and ventilation. The exposure time in tunnels is short compared to the time along outdoor roads, but the levels of pollutants are significantly higher inside tunnels. At the same time, the air that ventilates the vehicles is filtered. The exposure to air pollutants inside the vehicle cabin when traveling through a road tunnel depends mainly on three factors:
- Concentration of air pollutants in the tunnel
- Time spent in the tunnel
- The vehicles protective effect
Concentrations inside vehicles depend on ventilation setting and filter properties, meteorological parameters, vehicle speed, vehicle fleet composition, traffic flow [1-3] .
Variations in the reactivity for gaseous air pollutants mean that the probability for a gas sticking to for example a vehicle’s filter surfaces varies from one gas to another. For particles on the other hand, it is the variations in particle size which are of great importance for the deposition of particles and the penetration through filters. Commuting can contribute significantly to an individual's daily total exposure to air pollutants [1-4] . Exposure varies depending on the means of transport [1,5]. Commuters and commercial traffic drivers such as taxi drivers are exposed to similar levels inside their vehicles [6-8] . However, there is a large difference in the exposure time for commercial traffic drivers and everyday commuters. According to Yu et al. [6], taxi drivers in Los Angeles are exposed 6 times more to similar levels inside the vehicle compartment as commuters in Southern California.
1.2 Air exchange in vehicles
Several previous studies have examined commuters’ exposure to air pollutants and compared the exposure depending on the means of transportation. Most studies have focused on exposure to particles, often ultrafine particles (UFP <100 nm in diameter). The most commonly studied vehicle types are trains, cars, buses and bicycles, trams and commuting on foot also occur in some studies [1,3,4].
Air turnover time in vehicles is mainly affected by fan settings, open/ closed windows and vehicle cabin volume, but can to some extent be affected by, for example, the vehicle's speed, make and model year. Ott et al. [9] reported that between 0.92 and 79.0 total air volume exchanges per hour depending on ventilation settings, windows open or closed etc. Varied ventilation setting is a common method for investigating how the exposure to air pollutants vary within the same vehicle type (car brand). The combination of ventilation settings varies between studies, but it is common for all or some of the following settings to be compared with each other: open window, AC on, ventilation on and AC off and recirculation [2,10-13]. The turnover time for the air in the vehicle compartment is strongly dependent on the speed of the vehicle and whether the fan is set to recirculation. If, on the other hand, the fan is set to take in air from outside, the turnover time largely depends on the fan setting [8].
Season and surroundings are important for the air content of the vehicle cabin [11]. Concentrations of pollutants inside the vehicle cabin increase significantly during traffic congestion. [11,15]. Some studies compare newer and older car models [2,10,13]. These studies show that the age of the vehicle affects the pollutant concentration in the vehicle cabin, but in what way is not clear from the prevailing literature. A relevant result from these studies is that newer cars are generally more impermeable to air than older ones. When traveling in tunnels, this can lead to lower levels of particles (PM2.5) in the vehicle cabin of new cars compared to old ones, while at the same time the removal of pollutants is slower in a denser car (keeping the same ventilation settings).
According to one study, measured vehicle cabin concentrations of UFP are significantly higher while driving in tunnels compared to measured vehicle cabin concentrations in other studies carried out on open roads [2]. Johansson et al. [13] performed inside- and outside vehicle compartment measurements in five different vehicles; 3 cars, a van and a bus, in Södra länken 2012. Measurements were performed partly with the ventilation set to the second highest position and partly with recirculation activated. The study showed that particle levels inside the cabin are close to unaffected by the outdoor air when recirculation is activated. On the other hand, when the ventilation is on, the concentration of particles in the cabin is affected by the outdoor air. How large the impact is depends on the particle size. The study also showed that the number of particles in the vehicle cabin correlated well with the number inside the tunnel. The vehicle cabin concentrations of NOx also correlated well with the concentration inside the tunnel. Soot was measured in one of the cars and in the bus. The result of the measurements was that the passenger car compartment content of BC was about 41% of the tunnel content, and about 23% in the bus when the ventilation was on. The concentration was not affected by the outdoor air when recirculation was activated in the car [13]. With re-circulation on, the high levels inside the cabin can be prevented, but on the other hand, high levels of CO2 can accumulate in the car [15-17] .
1.3 Air filter efficiency
The air filter efficiency in vehicles is not the same for particles as for gases. For particles, the particle size is crucial. Coarse particles (> 1 μm) and the smallest (<0.1 μm) are filtered to a greater extent than particles between these sizes. The air flow rate through the filter affects the filtration efficiency; high air velocity reduces filtration efficiency. As the filters clogs up, due to particles sticking to the filters, the pressure increases, which has been shown to increase the levels of particles in vehicle compartments for the same content outside the car [18]. This is assumed to be due to air leaking through others paths in to the passenger compartment. Newer car filters are generally better than older ones, which can contribute to lower levels in newer cars compared to older ones [10,13].
1.4 Health studies
Today, there is limited research evidence of the long-term health effects that can arise due to exposure to high concentrations during limited time periods, such as driving through a longer road tunnel. Direct health effects during exposure to highly polluted air can manifest themselves in the form of nausea, impaired lung function, high blood pressure, dizziness and irritation of the nose, eyes and throat.
Madl et al. [19] investigated the impact on lung function with the aim of assessing the exposure of UFP in road tunnels and calculating the lung deposition for motorists. The study showed that particle concentrations decreased by 88% if the car was driven through the tunnel with the recirculation and AC on, compared to the same exposure time in tunnel air. The calculations of inhaled particle concentrations were performed using a deterministic model that randomly selects by the Monte Carlo method the geometry of the transport of inhaled particles in the airways [20]. Lung deposition of particles was estimated to decrease with 95%, compared to tunnel air, if the maximum filtration setting, recirculation and AC was utilized.
Other health-related problems such as blood pressure have been studied by Young et al. [21]. The study examined as 16 healthy people drove in Seattle's city center for four days in total, two days with particle filter inside the cars and two days without. The study measured particles, NOx, CO2 and O3. Similar to other studies, measurement results from the days without filters showed significantly higher particle levels than on days measured with filters. No significant difference in the measured concentration was found for NO2. The blood pressure was found to be strongly correlated with the filtration effect in the cars. High blood pressure was associated with high particle levels. It also turned out that in combination with high NO2 levels, the effect of particle exposure became higher. The conclusions based on the study were that inhaling traffic-related emissions increases blood pressure.
In a study of a group with allergic and non-allergic people, Muala et al. [22], the groups direct health effects during exposure to diesel exhaust. The study was performed in a controlled environment in a so-called exposure chamber with unfiltered/filtered air with UFP filter with / without activated carbon. The study showed that all participants experienced minor symptoms when exposed to completely unfiltered air in which the concentrations of UFP, NO2 and HC were significantly higher compared to filtered air. The differences between regular UFPfilters and UFP-filters with activated carbon filters were small but not negligible. Tests showed slightly improved lung function after exposure to polluted air filtrated through activated carbon filter than without.
The fact thar carbon filters improve air quality in vehicle cabins has been shown in several studies. Among others, Muala et al. [22] investigated health effects with a method similar to Muala et al. [23], but here also with inflammatory markers in the blood after exposure to diesel exhaust in the exposure chamber. Particle filters without activated carbon reduced particulate matter content by 46%, and with activated carbon 74% compared to unfiltered air. With activated carbon, NO2 and HC were also reduced by 75 and 50%, respectively, compared to unfiltered air. Here, too, the subjects experienced a significant difference with and without filters. On the other hand, it was shown that the diesel exhaust does not give a significant difference in the inflammatory markers in the blood after exposure compared to before in any scenario.
Literature studies related to health effects of exposure to (short-term) elevated levels of NO2 and particles are summarized by Sandström et al. [24] and Bellander et al. [25] and also Orru et al. [26-28] ).
2. Method
NOx, BC and CO2 were measured inside and outside vehicle cabins while driving through an almost 4 km long road tunnel in Stockholm (Södra Länken). All vehicles were driven back and forth four times in each direction giving a total of 8 passes through the tunnel per vehicle. Cabin temperature was set to 20°C with the air conditioning on and ventilation set on automatic. The decline in concentrations of BC, NOx and CO2 during the first minute after exiting the tunnel was used to estimate the rate of exchange of cabin air.
2.1 Instrumentation
NOx was measured using Model 405 nm NO2/NO/NOx Monitor™ (2B Technologies, 2100 Central Ave., Suite 105, Boulder, Colorado 80301, USA), BC was measured using an Aethalometer, (microAeth® Model AE51, AethLabs San Francisco, California, USA) and CO2 was measured using a non-dispersive infrared sensor (SENSEAIR K33 LP T/RH, Senseair AB, Delsbo, Sweden). All instruments were battery operated, and set to measure at 10 seconds intervals. Parallel studies of all instruments were carried out before the test. From a linear regression between the micro aethalometers they received an R2 above 0,99, the NOx-analysers had slightly lower R2 of 0,96. CO2 received an R2 of 0,97.
To enable measurements outside and inside the vehicles simultaneously a window inlet adapter was constructed, Figure 1. The adapter did not fit perfectly to all car windows due to variations in the window design, duct tape was therefor used to seal any gaps. The inlets for soot and NOx as well as one of the CO2-sensor which was fastened on the outside of the vehicle are also shown in Figure 1. Another CO2-sensor was situated in the backseat of the car. The soot and NOx-inlets inside the vehicle cabin were fastened to an elastic line which was strung between the driver’s seat and the passenger’s seat, see Figure 3.


2.2 Test path and vehicles
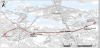
Södra Länken is the longest road tunnel in Sweden. Depicted in Figure 4, is the 3.8 km road tunnel as well as the shorter periods outside the tunnel in order to ventilate the car cabin from tunnel air, the shorter outside turn seen on the right side of the figure was not enough to fully ventilate the car cabin. Each vehicle was driven a total of 8 times through the tunnel, 4 times west-east, and 4 times east-west. Inside the tunnel there are several exits and accesses, which dilutes the air pollution inside the main tunnel, by either adding “fresher” air or removing polluted air. Furthermore, the tunnel has two ventilation towers.
Measurements were carried out in ten different new vehicles. 4 cars manufactured 2018, 4 from 2019 and 2 from 2017. The cars were chosen from size and exclusivity. Two small vehicles, Renault Zoe and BMW 325, 4 station wagons, Volvo V60, VW Passat, Seat Léon and Kia C’eed. 4 SUVs, Seat Tarraco, Subaru Forester, Audi Q3 and Mitsubishi Outlander. In Table 1 some information about each vehicle is given, however no information about what types of air filters each car was fitted with was available.

2.3 General relationship between tunnel and cabin concentrations
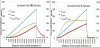
Figure 5 illustrates the theoretical relationship between the concentration inside the vehicle cabin and the tunnel air outside the vehicle, depending on the distance from the tunnel entrance and the turnover time for air inside the vehicle cabin. The relationship (green line in Figure 5) approaches a constant value equal to the proportion of the tunnel concentration entering the vehicle cabin, (mainly dependent on filter uptake). When this plateau is reached depends solemnly on the air exchange rate (turnover time) in the vehicle. For a 6 km long road tunnel with 50% filter uptake, the ratio between the passenger compartment and road tunnel will be about 40% if the turnover time is 30 minutes at which case the ratio never reaches 50%. At 3 minutes turnover time, the ratio becomes 50% and constant at about 3 km.
Results from test cars in Södra Länken show that the total exposure in each vehicle as well as the difference in exposure between the vehicles varied. This is assumed to be largely due to the filter capacity since all tested vehicles had significantly shorter turnover time than the travelling time for one tunnel passage. The filter efficiency varies depending on filter type and therefore the exposure, while driving in the road tunnel, differs between the tested vehicles.
Smaller vehicles with stronger ventilation will reach an equilibrium in air pollution between the tunnel air and inside vehicle cabin air sooner than a larger vehicle with less ventilation. After exiting the tunnel, a smaller car with stronger ventilation will more rapidly exchange the polluted air with “fresh” ambient air. While a larger vehicle with slow ventilation will take longer to reach tunnel/car equilibrium, but will also take longer to exchange the polluted air and refresh it after exiting the tunnel. The exposure which occurs after exiting the tunnel until the outdoor and in compartment air is equal, is a part of the total exposure to tunnel air.
In this study the ventilation was set to Automatic AC (Air Condition) and 20°C in the vehicle cabin for all test vehicles. This means that different vehicles will have different air volume flows which depends on for example the ambient temperature in relation to the passenger compartment temperature. The turnover time for the air in the vehicle cabin (τ) can be estimated based on how quickly concentrations decrease immediately after exiting the tunnel.. The change in concentrations in the vehicle cabin is due to the incoming air minus the outflowing air minus the deposition on walls and other surfaces inside the car, which is almost negligible for gasses.
Where τd is the time scale for the deposition. Just after the vehicle has passed out of the tunnel, the vehicle cabin concentration is much higher than the ambient air. If the ambient concentration is neglected in relation to the interior, the interior concentration can be written as:
The integral provides how the concentration in the vehicle cabin decreases due to ventilation and deposition:
Ambient NOx concentrations are very low compared to the concentrations inside a road tunnel and hardly any NOx would stick to the interior of the car compartment. The decline in NOx concentrations immediately after exiting the tunnel is used to calculate the turnover time, for consistency, only the first minute after exiting the tunnel for each tunnel passage was used to calculate the turnover time.
3. Results
3.1 In tunnel measurements
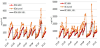
Figure 6 shows how the measured levels of soot particles and NOx vary outside and inside the vehicle cabin of the Mitsubishi Outlander for three of the vehicle’s trips through Södra Länken. The concentrations inside the vehicle cabin increase continuously as the concentrations in the tunnel increase as the car travels further in. When the car has passed out of the tunnel, the vehicle cabin concentrations drops more slowly than ambient concentrations. The turnover time for the air in the vehicle cabin depends on the volume of the cabin and the speed of the ventilation air. This shows that the levels in the vehicle cabin will be higher than the ambient concentrations for a short period after the vehicle has exited the tunnel. The NOx- and BC concentrations development with time is very similar because the ventilation is the same.
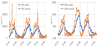
Figure 7 shows the measured concentrations of NOx and BC in- and outside of the vehicle cabin, as well as the calculated concentrations of NOx and BC inside the vehicle cabin using the outside concentrations together with the turnover time. Figure 7 shows a total of 8 tunnel passages, 4 times per direction. The calculated vehicle cabin concentrations corresponded very well with those measured. Vehicle cabin concentrations of BC in relation to BC in tunnel air was lower than the NOx/NOx ratio between the vehicle cabin and the tunnel air, meaning that soot particles are captured more efficiently than NOx by the air filter.
3.2 Calculated turnover time
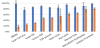
Estimated air turnover times for NOx, based on the decay of the NOx concentrations in the vehicle cabin when exiting the tunnel, varied between 1.1 and 1.8 minutes. This means that the air inside the vehicle has time to be replaced a few times inside the tunnel, since it takes about 4 minutes to drive through Södra Länken. For black carbon the turnover time varied between 0.76 and 1.5 minutes, see Figure 8.
Turnover time is not the same for soot as for NOx for each vehicle type. The variation is partly due to the deposition of soot inside the vehicles, which does not occur to any significant extent for NOx. The variation is also due to the turnover time being a calculated average value of all tunnel passages per vehicle. The BMW which was the second smallest vehicle probably had an automatic recirculation function which was switched on during certain conditions, which also affects the turnover time.
3.3 Filter efficiency
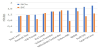
Figure 9 illustrates the ratio between the maximum vehicle cabin concentration and the maximum tunnel concentration. This ratio can be seen as an indication of how effective each vehicle's filter is.
The variation between the vehicles is larger for black carbon than for NOx. The maximum cabin concentration for BC ranges between 10% to 60% of that of the maximum tunnel concentration. This indicates that there is a big difference in the vehicles' filter efficiency for soot particles. This ratio also varies for NOx, although not as much as for BC. The filter efficiency for NOx is significantly lower than that for soot and also not proportional to the filter efficiency for soot for a given car, this becomes quite clear in Figure 9.
3.4 BC/NOx-ratios
NOx concentration has been proposed as governing for the air quality in road tunnels, not because of its direct health effects but mainly since it is an indicator of the exposure to exhaust gases, including soot particles. Since it is the exposure inside the vehicles that is decisive for the health effects, it is important to know the relationship between BC and NOx both outside and inside the vehicles.
The average ratio between BC and NOx in the tunnel air for all passes and all cars was 12.2 ± 1.1 mg g-1 NOx-1. This reflects the ratio in exhaust emissions and can be compared with the emission model HBEFA. Assuming evenly flowing traffic and an average speed of 67 km/h, the total weighted ratio for BC would be 4.3 mg g-1 NOx-1 according to HBEFA (version 4.0). That is, almost a third of the measured ratio. The inside vehicles ratios are lower than in the tunnel air, which reflects that a smaller proportion of soot particles pass into the vehicles compared to NOx. On average, the BC to NOx ratio in the vehicle cabin is 7.1 ± 1.9 mg BC g-1 NOx-1. This is roughly 60% of the BC to NOx ratio in the tunnel. The BC to NOx ratio varied greatly between vehicles, see Table 2.

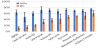
3.5 Road users’ exposure in Södra Länken
The total exposure a driver or passenger has received was calculated as the mean vehicle cabin concentration during the period from the tunnel entrance until the concentration inside the vehicle cabin reached 20% of what it was at the tunnel exit. The total exposure outside of the vehicle is calculated for the same time interval as the exposure inside. Exposure time varies between each tunnel passage depending on the traffic flow and on the turnover time for the air in the vehicle cabin. The total exposure was calculated as an average of four passages (out of a total of eight) for each car model, because the outside tunnel time in one direction was not sufficient to ventilate the tunnel air trapped in the vehicle cabin. In the other four passages, the outside time was more than enough to ventilate the cabin air.
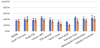
Figure 10 shows that the variation in total exposure to black carbon in the vehicle cabin depends largely on the car model; a car user’s exposure to BC varies between 20% to 80% compared the exposure driving a convertible through the tunnel. The variation between brands is smaller for NOx than for BC. The part of the total exposure to BC and NOx which occurs after exiting the tunnel can be seen in Figure 11.
4. Study Limitations
In the measurement results there are uncertainties such as variations in outside concentrations between each run, time in tunnel varies due to varying traffic flow. Peaks of both NOx and BC occurring outside the tunnel due to driving behind old vehicles with poorer exhaust purification. Due to varying traffic flow, concentrations in the tunnel varies between passes, in some runs there was a queue inside the tunnel. The fact that there were high peaks of both NOx and soot outside the tunnel contributes to uncertainty in the estimation of the cars' turnover time and the exposure due to the tunnel. Mean values of the tunnel passages have been used to decrease the influence of sporadic peaks.
Competing Interests
The authors declare that they have no competing interests.
Acknowledgments
Special thanks to Börje Norberg at SLB-analys for his work with the
NOx-analyzers.
Note: Graphy Publications remains neutral with regard to jurisdictional
claims in published maps and institutional affiliations.