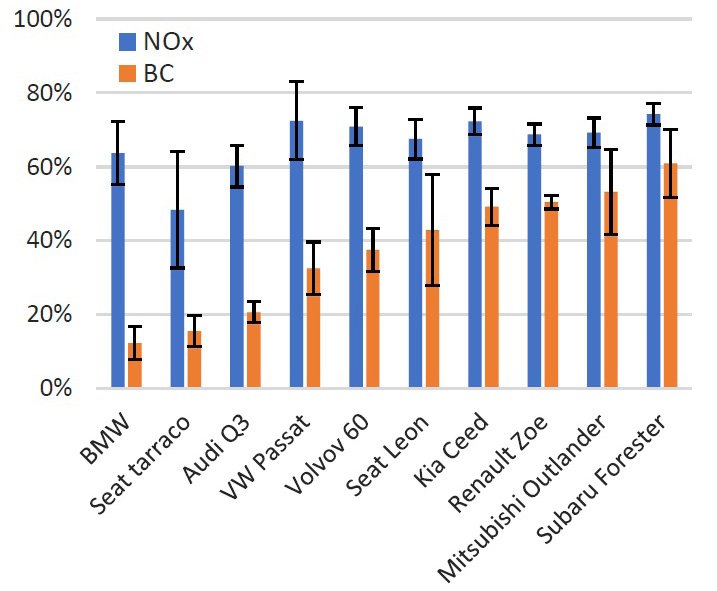
Figure 9:
The average 8 run maximum concentration inside the vehicle cabin divided by the 8 run average maximum concentration for tunnel air. BC (orange) and NOx (blue) for each vehicle.