


1. Introduction
In recent years, Japan has become an aging society. According to statistics for 2019, the elderly (65 years old and over) population was 35.73 million, and the ratio of the elderly to the total population was 28.9% [1]. While the elderly population ratio of Tokyo prefecture as a whole was 23.8%, the ratio of Tama City, which is located on the western outskirts of Tokyo, was 29.9%, higher than the national average [2].
As a person ages, he becomes more likely to need nursing care due to a decline in mental and physical abilities such as muscle strength [3], nutritional status [4], and cognitive functions, resulting in inadequate living functions and diminished social connections [5,6]. The increase in the number of these elderlies needing nursing care has become a major issue in welfare and public health [7,8].
Tama City, launched the Tama Frailty Preventive Project (TFPP) in 2017 to decrease the need for nursing care by early detection of frailty, which is a pre-stage of needing nursing care, for elderly people living in Tama City.
The Ministry of Health, Labor and Welfare in Japan has been providing a program for prevention of the need of care since 2006 using a Basic Checklist (BC) [9] to screen elderly people who do not receive long-term care insurance but are at high risk [10,11].In the BC, you are asked to answer "yes" or "no" to 25 questions about living conditions and physical and mental functions. The 25 question items cover 7 categories and consist of 5 items for activities of daily living, 5 for motor function, 2 for nutritional status, 3 for oral function, 2 for withdrawal, 3 for cognitive function and 5 for depressed state.
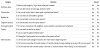
TFPP has developed the Frailty First Checklist (FFC) as a checklist for grasping the status of the frailty and pre-frailty more easily than the BC. The FFC consists of 13 items in 7 categories (Table 1). The 7 categories in FFC almost correspond to those in the BC. In other words, 2 items for "General life", 5 for "Motor function, 2 for "Nutrition status", 1 for "Oral function", 1 for "Cognitive function", 1 for "Social participation", and 1 for "Mental state". If two or more of these 13 items are considered to be possible frail/pre-frail signs, the person is asked to answer the BC (referred to as "second check" in the TFPP) to grasp the physical and mental states in detail. However, Tama City's TFPP has been in operation for only about three years, and its evaluation, especially the effectiveness of its own FFC, has not been assessed.
In this study, we analyzed the results obtained at the TFPP measurement meetings for Tama City's unique checklist, FFC, and examined the validity of question items and category classifications using factor analysis and correlation analysis.
2. Methods
This study was approved by the Ethics committee of Kokushikan University (approval #20001). We explained the contents of the study to participants both verbally and in writing. Written informed consent was obtained from the participants enrolled in this study. The analysis was based on the results of the TFPP survey conducted from April 2018 to the end of March 2019. The subjects were 631 (193 male and 438 female) residents of Tama City who participated in the TFPP. The average age was 77.3 ± 6.4 years.
The No. 11 "Yubi-wakka (finger ring) test" in the FFC tests whether the center of the calf can be surrounded by the thumb and forefinger of both hands. For statistical analysis, the answer in the left column in Table 1 was assigned to 0 value and the answer in the right column was assigned to one.
For analysis on the category, the total sum of the question items in each category was used as data.
The factor analysis and the calculation of the correlation coefficient matrix were performed for seven categories and five for question items related to "Motor function" (question Nos. 9 to 13).
For statistical analysis, KyPlot 5.0 (KyensLab Inc.) was used. Varimax rotation was performed for the factor analysis using the maximum likelihood method.
3. Results
3.1 Correlation analysis
Table 2 shows the correlation coefficient matrix of the seven categories. The most positive correlation was about 0.41 between "Healthy life" and "Vitality". High positive correlations (0.24 to 0.26) were found between "Cognitive function" and "Mental state", between "Healthy life" and "Nutrition state", and between "Healthy life" and "Cognitive function".
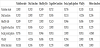
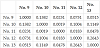
Table 3 shows the correlation coefficient matrix for the five questions related to "Motor function". The questions No.12 and No.13 showed a high positive correlation of about 0.26, but the correlation coefficients between other question items were 0.14 or less.
3.2 Factor analysis
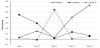
Factor analysis for seven categories was performed with three factors. Figure 1 shows the factor loadings of the categories. As for factor 1, the factor loadings of "Healthy life" and "Vitality" were high, followed by the factor loadings of "Social participation" and "Cognitive function". Factor 2 had the highest factor loading in "Motor function", and factor 3 had higher factor loadings in "Nutrition status" and "Oral function" than other category.
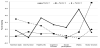
Factor analysis for the five question items of "Motor function" was performed with three factors. Figure 2 shows the factor loadings of the question items. In factor 1, No. 12 and No. 13 had highvalues of factor loading. Factor 1 has a high factor loading for No. 9 and No. 10. In factor 3, only the factor loading for No.11 showed a high value.
4. Discussion
The results of factor analysis for the seven categories suggested that by setting the number of factors to three, the seven categories could be grouped into three groups (Figure 1). Thus, factor 1 has a large weight in the four categories of “Healthy life”, “Social participation”, “Cognitive function”, and “Vitality”. Furthermore, factor 2 extracted "Motor function" and factor 3 extracted "Nutrition status" and "Oral function" related to dietary habits. Comparing with the correlation coefficient matrix in Table 2, "Healthy life", "Social participation", "Cognitive function", and "Vitality" are strongly positively correlated with each other, and these are summarized as one factor as similar factors. The correlation coefficient between “Nutrition status” and “Oral function” extracted as factor 3 was about 0.19, which was a relatively high value. On the other hand, "Motor function" was extracted as an independent factor in the factor analysis, but the correlation coefficient showed that the correlation coefficient with "Oral function" was relatively high at about 0.20. From these facts, it is considered that the association between the categories that cannot be grasped simply by the correlation coefficient was suggested by the factor analysis.
In Figure 1, “Motor function” was extracted as an independent factor. Therefore, factor analysis and calculation of the correlation matrix for the five questions related to "Motor function" were performed (Table 2). In the factor analysis, factor 1 has a large weight of No. 12 and No. 13, which are considered to have extracted the lower limb motor function. For these two items, the correlation coefficient also showed the highest value of about 0.26 as shown in Table 3. Factor 2 had a large weight in No. 9 and No. 10, and the correlation coefficient of these two items was relatively high at about 0.14. No. 9 was a question about grip strength and No.10 was a question about easiness to fall. There was a report that grip strength was related to quadriceps muscle strength and foot grip strength [12], suggesting a common factor between two functions. Factor 3 had a high factor loading only in the calf circumference of No. 11, suggesting that it was an independent factor.
5. Conclusion
The validity of the question items and category classification of the simple frail checklist developed by Tama City was examined using correlation analysis and factor analysis. In the factor analysis of the seven categories, aspects related to social life of the frail, i.e., "Healthy life ", "Social participation", "Cognitive function", and "Vitality", were extracted as factor 1, and "Motor function" as factor 2. Categories related to dietary habit such as "Nutrition status" and "Oral function" was extracted as factor 3.
Competing Interests
The authors declare that they have no competing interests.
Acknowledgments
We would like to thank the members of the Tama City Fail Prevention Study Team for their cooperation, and Prof. Dr. Koichi YOSHIOKA of Kokushikan University for his help in statistical analysis and manuscript preparation.