


1. Introduction
Sarcopenia, the loss of muscle mass due to aging, results in falls, fractures, and the onset of frailty, which is a state of increased weakness to stressors and is liable to have adverse health outcomes in old age [1,2] . Comparing people aged 80 years with those aged 20 years in Japan, the estimated muscle mass in the whole body as well as in the upper and lower limbs by regression analyses were 16.8%, 16.4%, and 30.9% lower in men and 11.0%, 3.0%, and 28.5% lower in women [3]. According to Cabinet Office, Government of Japan, The proportion of people aged ≥65 years in the total population has been rising and is projected to be 18.1 % of the total population by 2060 in the world [4]. As a result, it is likely that the number of people with sarcopenia will substantially increase. It is therefore important to properly detect sarcopenia as soon as possible to help minimize the incidence of falls, fractures, and the onset of frailty and a dependency associated with these.
The presence of sarcopenia is usually diagnosed by measuring lower appendicular muscle mass (AMM) and handgrip strength and/or gait speed [5,6] . AMM is normally measured by dual X-ray absorptiometry (DXA) or bioelectrical impedance analysis (BIA), instead of computed tomography and magnetic resonance imaging which are gold standards to measure muscle mass and the cut-off value of lower muscle mass using DXA or BIA has been proposed [5,6] . In contrast, DXA or BIA remains inconvenient for use and expensive in clinical practice.
Calf circumference (CC) is positively associated with AMM [7] and lower muscle mass is useful for determining the existence and extent of sarcopenia [8]. CC is easily and quickly determined with a tape measure, although it has been reported that the length of CC is affected by subcutaneous fat [9]. However, little has been done to clarify how CC affects AMM and appendicular fat mass (AFM). The limb circumferences are broadly measured using 4 observations: upper arm circumference (UC), forearm circumference (FC), thigh circumference (TC) and CC; however, the associations among UC, FC, and TC with AMM and AFM have not been well documented. To reveal among the relationship limb circumference and AMM and AFM might be helpful of selecting which parts of circumference are more suitable for detecting lower muscle mass for sarcopenia with lesser impact of fat mass, and lead to decrease the fall, fracture and the onset of frailty and preventing a dependency associated with these. First, the purpose of this study was to clarify the effect of UC, FC, TC and CC on AMM and AFM in healthy men and women having little evidence of edema and muscle atrophy caused by disease.
2. Methods
2.1 Participants
Total 77 healthy young men and women were recruited in this crosssectional study [age: 20-22 years (mean; 21.2 ± 0.6)]. The exclusion criteria were as follows: (1) they had a pacemaker, (2) the presence of a metal implant by surgery, and (3) they were habitually engaged in exercise (≥30 minutes/time and twice/week for 1 year) [10]. Three participants were excluded because of the presence of a metal implant by surgery (two) and habit of regular physical exercise (one). As a result, 74 participants were analyzed in this study. This study was approved by the ethics committee of Health Science University, and all subjects read and signed an informed consent form.
2.2 Limb circumference
Right UC (RUC), Left UC (LUC), Right FC (RFC), Left FC (LFC), Right TC (RTC), Left TC (LTC), Right CC (RCC), and Left CC (LCC) were measured twice at the largest points to the nearest 0.1 cm using a tape measure, and the resulting average values were used for analysis. In the RUC, LUC, RFC, and RFC, the subjects were in a sitting position with their upper limbs at the side of their body and their hands relaxed (neutral position). The RTC and LTC values were measured from a point 15 cm from the patella on the edge which reflected on the entire muscle mass of the thigh when in the supine position with the knee joint extended. The RCC and LCC were measured with the subjects in the supine position with mild flexed knee joint. In our previous study, the interclass correlation coefficient (1, 1) of circumference was highly reproducible (r = 0.98 and r = 0.99, respectively) [11].
2.3 Appendicular muscle mass (AMM) and appendicular fat mass (AFM)
AMM and AFM were estimated using segmental multi frequency bioelectrical impedance analysis (BIA) at 5 KHz, 50 KHz, and 250 KHz (ioi 353s, Owa Corporation, Tokyo, Japan). BIA is widely regarded as a reliable and valid technique for evaluating both MM and FM [12,13] . Subjects stood with bare feet on the device and their body weight was automatically measured, after we feed information such as their name (ID), age, sex, and height into the device. Subjects held both handle sensors with their palms and contacted both foot sensors with the soles of their feet, allowing the machine to measure the impedance of the body.
2.4 Statistical analysis
Statistical evaluation was performed using JMP 11 software (SAS Institute Inc., Cary, NC, USA). The data are expressed as means ± standard deviations (SD). The differences in characteristics between men and women were evaluated using an unpaired t-test. Pearson’s correlation coefficient was also used for estimating the association of AMM and AFM with limb circumference in men and women. Further, If a significant difference between AMM and AFM was found by sex, a multiple regression analysis adjusted for sex was performed between AMM and/or AFM and limb circumference. Statistical significance was set at P < 0.05.
3. Results
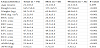
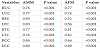
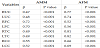
Characteristics of study participants are summarized in Table 1. There was no significant difference with respect to age in men and women (p > 0.05, Table 1). Height, weight, BMI, RUC, LUC, RFC, LFC, RTC, LTC, RCC, LCC, and AMM in men were significantly higher than those in women (P < 0.001, Table1), but this was not the case for AFM (p > 0.05, Table 1). RUC, LUC, RFC, LFC, RTC, LTC, RCC, and LCC were significantly related to AMM (P < 0.001, Table 2). We also found that RUC, LUC RFC, LFC, RTC, LTC, RCC, and LCC displayed a significant association with AFM (P < 0.001, Table 2). The correlation coefficients of RFC and LFC with AFM were lower than those of RUC, LUC, RTC, LTC, RCC, and LCC (Table2). In a regression analysis, RUC, LUC, RFC, LFC, RTC, LTC, RCC, and LCC were the independent explanators of AMM after adjusting sex (P < 0.001, Table 3). AFM was also predicted by RUC, LUC, RFC, LFC, RTC, LTC, RCC, and LCC (not adjusted, P < 0.001, Table 3).
4. Discussion
In this study, RUC, LUC, RFC, LFC, RTC, LTC, RCC, and LCC were significantly associated with AMM. RUC, LUC RFC, LFC, RTC, LTC, RCC, and LCC were also significantly related to AFM, and lower association of RFC and LFC with AFM were observed compared with those of RUC, LUC, RTC, LTC, RCC, and LCC. These results show that FC might reflect on AMM with less impact than AFM in healthy young men and women.
The average lengths of UC and CC for individuals in Japan aged 18-24 years are, for males, 26.96±2.97 and 35.83± 3.33 cm, and for women these values are 24.87± 2.49 and 34.65±2.79 cm [14]. In our current study, the averages of UC and CC are 26.5 and 26.2 cm (right and left) and 36.6 and 36.6 cm (right and left) in men and 23.5 and 23.2 cm (right and left) and 33.1 and 33.5 cm (right and left) in women. Therefore, it is likely that we recruited young men and women of normal proportions in Japan. These circumference measurements are suitable for determining changes in the volume of a body part [15]. In this study, RUC, LUC, RFC, LFC, RTC, LTC, RCC, and LCC showed significantly positive association with AMM and higher correlation coefficients and standard partial regression coefficients of RFC, LFC, RCC, and LCC were observed. Conversely, the lowest correlation coefficients and standard partial regression coefficients of RFC and LFC with AFM were observed and RCC and LCC also showed a tendency to have lower correlation coefficients and standard partial regression coefficients with AFM than those of RUC, LUC, RTC, and LTC in this study. It has been reported that subcutaneous fat thickness in the posterior surface of the upper arm and thigh and the anterior surface of the thigh are thicker than in the forearm and in both the anterior and posterior surface of the calf for both men and women [16]. Therefore, in this study we expected to observe lower correlation coefficients and standard partial regression coefficients involving the associations among RFC, LFC, RCC, and LCC with AFM than those of RUC, LUC, RTC and LTC. In determining lower AMM, it might be better to use RFC, LFC, RCC, and LCC because of lesser impact of fat mass.
CC is useful in assessing lower muscle mass when diagnosing sarcopenia [8]. In this study, we found that RCC and LCC were more strongly related to AFM than RFC and LFC. CC is also likely to be affected by gravity due to its location on the peripheral part of the lower limbs. We often experience the elderly who had an edema of the lower leg, and clearly such an issue might lead to an over estimation of the true circumference. One might consider substituting FC for CC in assessing lower muscle mass because of the less likely influence of edema. Future studies need to clarify the cut-off value of FC when evaluating lower muscle mass for judging sarcopenia.
5. Limitations of the Study
The limitations of this study are several. First, the sample size was small, and in the future it will be useful to recruit more participants. Second, the participants were all healthy young men and women. In future studies, we need to clarify the association of limb circumference with AMM and AFM in the elderly men and women. Third, AMM and AFM were measured using only the BIA technique in this study. We also should determine the relationship between limb circumference and AMM as well as AFM using DXA, in both young and elderly men and women in future studies.
6. Conclusion
These results show that FC might reflect on AMM with less impact than AFM in healthy young men and women. It might be helpful of selecting which parts of circumference are more suitable for detecting lower muscle mass for sarcopenia with lesser impact of fat mass.
Competing Interests
The author declare that there is no competing interests regarding the publication of this article.