


1. Introduction
Numerous clinical tests are used by clinicians and researchers for the assessment of endurance of several muscular groups in healthy and symptomatic participants (e.g. trunk extensors, neck flexors or ankle plantar flexors) [1-4]. Most tests aiming to measure muscle endurance consist in isometrically maintaining a contraction as long as possible or performing as many movements as possible with a specific resistance [5,6]. Muscle endurance is appreciated by measuring the holding time, counting the number of repetitions or by means of surface electromyography (EMG) fatigue related parameters [7] . Individual factors such as motivation, fear of pain and competitiveness can influence the objective measurement of muscle endurance [7] . Demoulin et al. [8] suggested to ask the subjects to give an overall perception about how hard the exercise felt according to the Borg Rating of Perceived Exertion Scale (Borg RPE), a 15-point single-item scale ranging from 6 to 20 (with anchors ranging from 6 “No exertion” to 20 “Maximum exertion”) [9] . This subjective assessment, in addition to objective assessment of muscle endurance, might be a way to better reflect muscle fatigability while limiting the interference of individual factors.8 Indeed, authors reported significant correlations between the Borg RPE, EMG and endurance time suggesting a close relationship between subjective and objective assessment of muscle fatigue [5] .
Deficits in hip abductor strength and endurance, mainly in women, have been related to common lower extremity conditions [10-13] Studies showed that impaired muscular control of the hip abductors can increase pelvic, femoral and tibial movements in frontal plane and, therefore, increase joint stress during dynamic movements [14-16]. In a previous study, Van Cant et al developed the hip abductor isometric endurance test and assessed its test-retest reliability in 34 healthy females [17] . The maximal holding time (average performance of 87.7 +/- 38.73 seconds) demonstrated good intraclass correlation coefficient (ICC = 0.73) with a standard error of measurement (SEM) and minimal detectable change (MDC) of 19.8 and 54.9 seconds, respectively. In that study, the minimum Borg score was 13 suggesting that muscle endurance might have been underestimated in some participants thereby affecting the ICC, SEM and MDC of the test.
The purpose of the present study was to compare the test-retest reliability of the hip abductor isometric endurance test in healthy females when using the Borg scale in two different ways. In one group, every 15 s and at the end of the test, the subject was asked to give an overall perception about how hard the exercise felt according to the Borg RPE. In the other group, the subject was asked to give an overall perception about how hard the exercise felt according to the Borg RPE, but only at the end of the test. It was hypothesized that the rates of perceived exertion would be largest and more reliable in the first group and that would be enhanced test-retest reliability of the hip abductor isometric endurance test. Because authors suggest that hip performance deficit is more prevalent in females than in males, [18,19] only females were recruited to participate in this study.
2. Methods
2.1 Subjects
Healthy females, aged 18-30 years, were recruited among students of the Institute Parnasse-ISEI, Brussels, Belgium. Participants with a history of orthopedic injury or surgery of the lower limb within the past 12 months, cardiovascular, pulmonary, neurological, or systemic conditions were excluded from the study. Additionally, sedentary subjects or with a history a low back or lower limb pain or who had been diagnosed with a previous ligament injury of the knee, ankle or hip were also excluded from this study.
A total of 85 subjects were enrolled in the study and randomly assigned, using random numbers, into two experimental groups (group A and group B). All subjects gave written consent to participation in the study, which was approved by the Hospital and Departmental Ethics Committee, Saint-Luc - UCL (Brussels).
2.2 Procedures
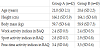
The participants attended two identical assessment sessions, spaced by seven days. Seventy-one participants (34 in group A and 37 in group B) completed all procedures, whereas 15 participants were excluded between both sessions. The causes of exclusion were strenuous physical exercise involving the hip the day before the second session (n=13) and absence of attendance of the second session (n=2). Data from participants excluded between both sessions were not used in the final statistical analysis. All data were collected by the same investigators, two fourth-year physical therapy students, under the direct supervision of a physical therapist with over 10 years of clinical experience. Participant demographics and characteristics, such as age, weight, body mass and physical activity levels were collected. To assess physical activity levels, the French version of the Baecke Activity Questionnaire (BAQ), validated by Bigard and Dufaurez, [20] was completed. The BAQ is a short questionnaire including a total of 16 questions classified into three domains receiving a score from one to five: work, sports, and non-sports leisure activity [21] .
During both sessions, all participants performed a five-minute sub-maximal warm-up on a stationary cycle. In both groups, subjects then performed the hip abductor isometric endurance test (described further below) with the dominant limb (defined as the limb used for kicking a soccer ball). In the first group (group A), every 15 s and at the end of the test, the subject was asked to give an overall perception about how hard the exercise felt according to the Borg RPE. In the second group (group B), the subject was asked to give an overall perception about how hard the exercise felt according to the Borg RPE, but only at the end of the test.
2.3 The hip abductor isometric endurance test
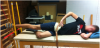
To perform the hip abductor isometric endurance test, the subject was in a side lying position on the examination table with the evaluated hip placed superiorly in neutral alignment and with the pelvis stabilized by straps. The opposite limb was flexed at the hip and knee. The hand of the ipsilateral upper limb was placed on the pelvis (Figure 1).
Considering that previous studies reported that the muscle contractions elicited by tests evaluating isometric endurance, such as the “Sorensen test”, were found to be equal to 40–52% of the maximal voluntary contractile force, [2] an additional resistance, corresponding to 7.5% of body mass, was placed on the ankle of the evaluated limb. Indeed, prior investigations that assessed maximal isometric strength of hip abductors in side lying position by placing the hand-held dynamometer near the lateral malleolus reported values ranging from 14% to 22% of body mass [18,19].
Before beginning the test, the subject was allowed to rest the limb using a cable sling. Upon command, the subject was instructed to isometrically hold the limb in a horizontal position, aligned with the trunk, knee extended and to stabilize the pelvic and scapular girdles. In order to control for the horizontality of the leg, a horizontal bar, fixed to vertical bars, was placed 5 cm underneath the malleolus (Figure 1). Moreover, a mirror was positioned close to the examination table so that the participants could control the horizontal position of the limb during the test. The time during which the subject held the limb straight and horizontal was recorded. The test was stopped when the participant could no longer control the horizontal posture (contact with the bars for more than 5s) despite investigator warnings, could no longer maintain the trunk position or until she reached the limit of fatigue. Standardized instructions and verbal encouragement were provided to all participants.
2.4 Statistical analysis
The test-retest reliability of the hip abductor isometric endurance test in both groups was calculated with a two-way random model intraclass correlation coefficient (ICC2,1). Reliability coefficients were considered to be poor for an ICC less than 0.51, moderate between 0.51 and 0.70, good between 0.70 and 0.90 and very good for an ICC greater than 0.9022. The SEM was calculated as SD×√1-ICC, where SD is the SD of all scores from the participants [23] . The MDC was calculated as SEM×1.96×√2 to construct a 95% CI [23] .
Because Borg scale data need to be treated as ordered categorical data, contingency tables were constructed using the data collected between the pairs of test sessions and the percentage agreement was calculated (PA) [6] . Cohen’s Kappa values (K) was used to establish test-retest reliability of perception of effort. Agreement was considered to be slight for Kappa values less than 0.20, fair between 0.21 and 0.40, moderate between 0.41 and 0.60, substantial between 0.60 and 0.80 and almost perfect between 0.81 and 1 [24] .
The Shapiro–Wilk test was used to examine whether continuous variables were normally distributed. Independent t tests were used to assess the difference between both groups for the hip abductor isometric endurance test. Mann-Whitney U tests for non-normally distributed data were used to calculate the difference between both groups in the rate of perceived exertion.
The statistical analyses were performed using SPSS statistical software (SPSS Inc, Chicago Illinois) with a significance level of p <0.05.
3. Results
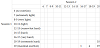
Characteristics and demographics data are presented in Table 1. Descriptive statistics by test session are reported in Tables 2 and 3.
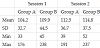
Abbreviations:- SD: Standard Deviation, Min: Minimum, Max: Maximum.
3.1 Test-retest reliability
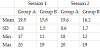
Table 4 presents data of the test-retest reliability of endurance time (ICC, SEM and MDC). Both groups demonstrated good test-retest reliability (ICC = 0.83 for group A and 0.77 for group B). The SEM was 11.7 seconds and the MDC, 32.4 seconds for group A. For group B, the SEM and the MDC were 14.6 and 40.4 seconds, respectively.
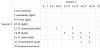
Concerning perception of effort, the percentage of agreement between test sessions was 85% for group A and 43% for group B and the weighted kappa value was, respectively, 0.72 and 0.22 (Table 4). The contingency tables are presented in Table 5 and Table 6.
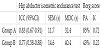
Abbreviations:- ICC: Intra Class Correlation Coefficient, SEM: Standard Error of Measurement, MDC: Minimal Detectable Change, PA: Percentage of Agreement, K: Weighted Kappa.
3.2 Differences between group A and group B
The hip abductor isometric endurance test results of both sessions for groups A and B were compared. No statistical significant differences were reported (p = 0.55). At the end of the test, when comparing the rate of perceived exertion in group A and B, Borg RPE was significantly higher in group A for both sessions (p = 0.0005).
4. Discussion
The primary aim of the present study was to determine the testretest reliability of the hip abductor isometric endurance test in healthy females depending on two different uses of the Borg scale. It was hypothesized that the test-retest reliability would be enhanced when the subjects rated subjective fatigue using the Borg scale every 15 s and at the end of the test (group A) rather than only at the end of the test (group B). The results support our hypothesis. Indeed, the ICC, SEM and MDC were, respectively, 0.83, 11.7 s and 32.4 s for the group A and 0.77, 14.6 s and 40.4 s for the group B.
Direct comparison of our results to previous studies was difficult due to lack of literature on the influence of perception of effort during ahipisometric endurance test [5] . Evaluated muscle fatigue during a modified Sorensen test (an isometric endurance test of the trunk extensor muscles) in healthy subjects using EMG, endurance time and the Borg scale. Similarly to the present study, the Borg scale was used every 15 s during the test to assess the subjective fatigue. The results showed that EMG spectral parameters and endurance time have a close relationship to the Borg scale, meaning that subjective perception of fatigue grows linearly up to a certain limit with objective muscle fatigue during an isometric endurance test. When reaching the limit of endurance of the hip abductor isometric endurance test, Borg scores were 18 or maximum in all subjects tested in the group A except for one who rated 16 in the second session. In the group B, Borg scores were 18 or maximum only for 10 subjects. Moreover, the Borg score variation at the end of the test was quite large in the group B (from 11 to 19) in comparison to the group A (from 18 to 20) in both sessions. Gandevia [25] reported that if muscular contraction continues beyond 10 s, central factors affect performance. Berchicci and al26 confirmed that peripheral fatigue occurring during submaximal lower limb isometric contraction is associated with central fatigue arising from the high cognitive processing that is required to correctly perform the task and emotional factors, such as motivation and attention. A way of evaluating central fatigue is using the Borg scale [27] . The effort perception refers to all subjective sensations presented during the performance of the exercise and it is associated with prefrontal cortical areas where current activities are compared with previous ones as part of the decision-making process of the necessary intensity of contraction [27] . This suggests that, in the present study, level of peripheral fatigue during the hip abductor isometric endurance test was, plausibly, different in both groups and could have affected the reliability of the test.
The Kappa value of the Borg score was 0.72 for the group A, indicating substantial agreement between both sessions, and 0.22 for the group B, indicating fair agreement. Similarly, the percentage of agreement between test sessions was 85% for group A and 43% for group B. It seems therefore that to ask subjects, every 15 s and at the end of the test, to give an overall perception about how hard the exercise felt according to the Borg RPE increases reliability of subjective perception fatigue at the end of the test. The above mentioned close relationship between endurance time and Borg scale can explain why ICC, SEM and MDC of endurance time of the hip abductor isometric endurance test were better in the group A. The clinical implications of the present findings are relevant because it means that clinicians must ensure that patient have similar Borg score at the end of two endurance tests sessions in order to compare the time endurance performance.
While no significant differences between both groups were reported for endurance time in the hip abductor isometric endurance test, the Borg score was significantly higher in group A for both sessions. According to the significant correlation between the Borg score and endurance time, we would have expected to have higher endurance time in group A. The absence of significant difference between both groups can be explained by the fact that beyond a Borg rating of 16- 17, Dedering et al. [5] reported a non-linear relationship between Borg score and endurance time when the endurance time was about 60% of the total contraction time. In the present study, for example, some of the subjects were able to continue the hip abductor isometric endurance test more than 15 seconds even though they rated their perceived fatigue as 20. The authors hypothesized that the Borg score is not sensitive enough, and therefore a scale with more steps should be considered.
Finally, a previous study assessed the test-retest reliability of the hip abductor isometric endurance test in 34 healthy females [17] . The Borg scale was used only at the end of the test, similarly to group B, to assess the subjective fatigue and the Borg score ranged from 13 to 19. Authors found ICC of 0.73 and SEM% of 22.5%. In the present study, ICC and SEM% were 0.83 and 10.7% for the group A and 0.77 and 12.9% for the group B. This greater reliability might be explained by the fact that two investigators collected together all data versus only one investigator in the study by Van Cant et al.17 Moreover, a few methodological differences were present between both studies regarding the isometric endurance test. Only in the present study, the pelvis was stabilized by straps and in order to control for the horizontality of the leg, a horizontal bar, fixed to vertical bars, was placed underneath the malleolus. Lastly, in contrast to the previous study, we positioned a mirror close to the examination table so that the participants could control the horizontal position of the limb during the test.
Some limitations of the present study have to be mentioned. Although their use would have allowed to clearly distinguishing between central and peripheral fatigue, electroencephalography and electromyography was not used in the present study.26 Next, although cautions to control the position of subjects were taken, the position during the test may have allowed for surrounding or contra-lateral muscle recruitment. Mutchler et al28 reported that this compensation may be the underlying cause for the variability in fatigue characteristics and endurance time. Finally, the subjects tested in the present study are healthy females. The results should not be generalized to males or females suffering from musculoskeletal pain.
5. Conclusion
These findings support the use of the Borg scale every 15 s and at the end of the hip abductor isometric endurance test in order to enhance the test-retest reliability. Future studies are needed to determine if results are similar for other endurance tests and in unhealthy peoples.
Competing Interests
The authors declare that they have no competing interests.
References
- Biering-Sørensen F (1984) Physical measurements as risk indicators for low-back trouble over a one-year period. Spine (Phila Pa 1976) 9: 106-119 [CrossRef] [Google Scholar] [PubMed]
- Demoulin C, Vanderthommen M, Duysens C, Crielaard JM (2006) Spinal muscle evaluation using the Sorensen test: a critical appraisal of the literature. Joint Bone Spine 73: 43-50 [CrossRef] [Google Scholar] [PubMed]
- Harris KD, Heer DM, Roy TC, Santos DM, Whitman JM, et al. (2005) Reliability of a measurement of neck flexor muscle endurance. Phys Ther 85: 1349-1355 [CrossRef] [Google Scholar] [PubMed]
- Sman AD, Hiller CE, Imer A, Ocsing A, Burns J, et al. (2014) Design and reliability of a novel heel rise test measuring device for plantarflexion endurance. Biomed Res Int 2014: 391646 [CrossRef] [Google Scholar] [PubMed]
- Dedering A, Németh G, Harms-Ringdahl K (1999) Correlation between electromyographic spectral changes and subjective assessment of lumbar muscle fatigue in subjects without pain from the lower back. Clin Biomech (Bristol, Avon) 14: 103-111 [CrossRef] [Google Scholar] [PubMed]
- Dedering A, Roos af Hjelmsäter M, Elfving B, Harms-Ringdahl K, Németh G (2000) Between-days reliability of subjective and objective assessments of back extensor muscle fatigue in subjects without lower-back pain. J Electromyogr Kinesio 10: 151-158 [CrossRef] [Google Scholar] [PubMed]
- Kankaanpää M, Taimela S, Webber CL Jr, Airaksinen O, Hänninen O (1997) Lumbar paraspinal muscle fatigability in repetitive isoinertial loading: EMG spectral indices, Borg scale and endurance time. Eur J Appl Physiol Occup Physiol 76: 236-242 [CrossRef] [Google Scholar] [PubMed]
- Christophe D, Delphine S, Laurent S, Didier M, Jean-Michel C, et al. (2008) Reproducibility and Suitability of Clinical Assessments of Trunk Flexor and Extensor Muscles. J Muscoskel Pain 16: 298-308 [CrossRef] [Google Scholar]
- Muyor JM (2013) Exercise Intensity and Validity of the Ratings of Perceived Exertion (Borg and OMNI Scales) in an Indoor Cycling Session. J Hum Kinet 39: 93-101 [CrossRef] [Google Scholar] [PubMed]
- Cowan SM, Crossley KM, Bennell KL (2009) Altered hip and trunk muscle function in individuals with patellofemoral pain. Br J Sports Med 43: 584- 588 [CrossRef] [Google Scholar] [PubMed]
- Horstmann T, Listringhaus R, Brauner T, Grau S, Mündermann A, et al. (2013) Minimizing preoperative and postoperative limping in patients after total hip arthroplasty: relevance of hip muscle strength and endurance. Am J Phys Med Rehabil 92: 1060-1069 [CrossRef] [Google Scholar] [PubMed]
- Van Cant J, Pineux C, Pitance L, Feipel V (2014) Hip muscle strength and endurance in females with patellofemoral pain: a systematic review with meta-analysis. Int J Sports Phys Ther 9: 564-582 [Google Scholar] [PubMed]
- Prins MR, van der Wurff P (2009) Females with patellofemoral pain syndrome have weak hip muscles: a systematic review. Aust J Physiother 55: 9-15 [CrossRef] [Google Scholar] [PubMed]
- Dierks TA, Manal KT, Hamill J, Davis IS (2008) Proximal and distal influences on hip and knee kinematics in runners with patellofemoral pain during a prolonged run. J Orthop Sports Phys Ther 38: 448-456 [CrossRef] [Google Scholar] [PubMed]
- Bolgla LA, Malone TR, Umberger BR, Uhl TL (2008) Hip strength and hip and knee kinematics during stair descent in females with and without patellofemoral pain syndrome. J Orthop Sports Phys Ther 38: 12-18 [CrossRef] [Google Scholar] [PubMed]
- Powers CM (2010) The influence of abnormal hip mechanics on knee injury: a biomechanical perspective. J Orthop Sports Phys Ther 40: 42-51 [CrossRef] [Google Scholar] [PubMed]
- Van Cant J, Dumont G, Pitance L, Demoulin C, Feipel V (2016) Test-retest Reliability Of Two Clinical Tests For The Assessment Of Hip Abductor Endurance In Healthy Females. Int J Sports Phys Ther 11: 24-33 [Google Scholar] [PubMed]
- Robinson RL, Nee RJ (2007) Analysis of hip strength in females seeking physical therapy treatment for unilateral patellofemoral pain syndrome. J Orthop Sports Phys Ther 37: 232-238 [CrossRef] [Google Scholar] [PubMed]
- Magalhães E1, Fukuda TY, Sacramento SN, Forgas A, Cohen M, et al. (2010) A comparison of hip strength between sedentary females with and without patellofemoral pain syndrome. J Orthop Sports Phys Ther 40: 641- 647 [CrossRef] [Google Scholar] [PubMed]
- Bigard AX, Duforez F (1992) Détermination de l'activité physique par questionnaire de Baecke validation du questionnaire auto-administrable de Baecke. Science & Sports 7: 215-221 [CrossRef] [Google Scholar]
- Ono R, Hirata S, Yamada M, Nishiyama T, Kurosaka M, et al. (2007) Reliability and validity of the Baecke physical activity questionnaire in adult women with hip disorders. BMC Musculoskelet Disord 8: 61 [CrossRef] [Google Scholar] [PubMed]
- Julia M, Dupeyron A, Laffont I, Parisaux JM, Lemoine F, et al. (2010) Reproducibility of isokinetic peak torque assessments of the hip flexor and extensor muscles. Ann Phys Rehabil Med 53: 293-305 [CrossRef] [Google Scholar] [PubMed]
- Weir JP (2005) Quantifying test-retest reliability using the intraclass correlation coefficient and the SEM. J Strength Cond Res 19: 231-240 [CrossRef] [Google Scholar] [PubMed]
- McHugh ML (2012) Interrater reliability: the kappa statistic. Biochem Med (Zagreb) 22: 276-282 [Google Scholar] [PubMed]
- Gandevia SC (1998) Neural control in human muscle fatigue: changes in muscle afferents, motoneurones and motor cortical drive [corrected]. Acta Physiol Scand 162: 275-283 [CrossRef] [Google Scholar] [PubMed]
- Berchicci M, Menotti F, Macaluso A, Di Russo F (2013) The neurophysiology of central and peripheral fatigue during sub-maximal lower limb isometric contractions. Front Hum Neurosci 7: 135 [CrossRef] [Google Scholar] [PubMed]
- Silva DC, Nunes MKG, Teixeira SS, Orsini M, Gaitan F, et al. (2015) The fatigue of central origin as performance restrictor in rehabilitation programs. Phys Med Rehabil Int 2: 1041 [Google Scholar]
- Mutchler JA, Weinhandl JT, Hoch MC, Van Lunen BL (2015) Reliability and fatigue characteristics of a standing hip isometric endurance protocol. J Electromyogr Kinesiol 25: 667-674 [CrossRef] [Google Scholar] [PubMed]