


1. Introduction
It is well known that both type 1 and type 2 diabetic patients shows decrease of muscle strength around knee and ankle [1,2] . These impaired motor functions may contribute to several movement disorders in diabetic patient such as an increased risk of falling, altered gait and balance, and increased body sway [3-5]. These disturbances, however, can be improved by exercise training [6]. Animal experiments using type 1 diabetic model also showed that decrease of muscle strength predominantly occurred on type II (fast) muscle fibers [7]. Interestingly, in contrast to human, endurance-exercise training does not prevent or increase muscle weakness in type 1 diabetic rats [8]. This discrepancy may cause by difference of type of diabetes. In previous study, most of clinical research were conducted on type 2 diabetic patients, on the other hand, animal experiment were conducted on type 1 diabetic model. Therefore, there is a need to examine alterations of muscle strength and effect of exercise using type 2 diabetic models.
The Otuska Long-Evans Tokushima Fatty (OLETF) rat is an established model of human type 2 diabetes mellitus which develops a diabetic syndrome by 25 weeks of age [9]. In this study, we examined the effect of exercise training on medial gastrocnemius (MG) muscle and soleus (SOL) muscle strength in OLETF rats. Because of type dependent muscle atrophy in diabetic model, it is important to compare “fast” MG muscle (predominance of type II fibers) and “slow” SOL muscle (predominance of type Ifibers) [10].
2. Methods
All animal experiments were carried out in accordance with the National Institutes of Health guide for the care and use of Laboratory animals (NIH Publications No. 8023, revised 1978). The Animal Ethics Committee of Health Science University approved all the experimental procedures. Data are presented as mean ± S.D. The significance of differences was evaluated by two-tailed multiple t-tests with Bonferroni correction following an ANOVA using computer software (Prism, GraphPad, La Jolla, CA).
3. Experimental Design
The OLEFT rats were randomly divided into either an exercise training (OLETF-EX, n = 3) or sedentary group (OLETF-SED, n = 3), while the LETO rats were used as a control group (LETO-SED, n = 4). The OLETF rats in the exercise-training group were forced to run on treadmill over the 15 weeks period. In contrast, the OLETF rats in the non-exercise group and the LETO rats were kept without exercise training. Forty-eight hours after the last session of the exercise training, an oral glucose tolerance test (OGTT) was employed to test glucose tolerance. After that, the rats were used to measure muscle contraction.
4. Exercise Protocol
From 25 weeks old, the OLETF rats in the exercise group were forced to run on a treadmill for 60 min once a day, five times a week for 15 weeks. The exercise intensity consisted of running at a speed of 12.0 – 17.0 m/min. The initial speed of the treadmill was set at 12 m/min and was increased gradually, after 4 weeks from beginning of exercise treadmill speed was reached about 17.0 m/min.
5. OGTT
At 40 weeks old, OGTT was conducted for assay glucose tolerance. After a 12 hours fasting period, animals were anesthetized with 4 % halothane at induction of anesthesia and maintained with inhalation halothane at 1.5 to 2%. The glucose solution dissolved in water (including 1g / kg glucose) was either injected into the stomach by a polyethylene tube (20-gauge, 40 mm long curved), and the serum blood glucose level was obtained by pricking the tail vein using glucometer at time 0, 30, 60, 90 and 120 minutes.
6. Measurement of Muscle Contraction
After OGTT, the animals were anesthetized with 4 % halothane at induction of anesthesia and maintained with inhalation halothane at 1.5 to 2%. Subsequently, tibial nerve was severed at a proximal point approximately 2 cm from the tibial nerve and the nerve was then placed on cuff electrodes. Nerve branches from the tibial nerve, innervating other muscles than the GM / SOL, were also severed. A screw at the tibia fixed the hind limb and the achilles tendon was attached to a force transducer. During the experiment, both the muscle and its surrounding were kept moist at physiological temperature (34-35°C). The twitch force of MG / SOL was produced by single-pulse nerve supramaximal stimulation at optimum length, defined as the length at which maximal twitch tension is produced. The tensions were digitized with a sample rate of 200 kHz (PowerLab, AD Instruments, Castle Hill, NSW, Australia). After the experiment, maximal force, time to peak tension (TTP) and half-relaxation time (HRT) were calculated from the sampled data.
7. Results
7.1 OGTT and body weight
The results of the OGTT for all groups are shown in Table 1 and Figure 1. There was a significant difference between OLETF-SED and LETO-SED at the initial point of the test. On the other hand, there was no difference between OLETF-EX and LETO-SED. At 15 min after the glucose injection, the blood glucose level in OLETFSED was significantly higher than that of OLETF-EX and LETO-SED. Additionally, at 30 min after the glucose injection, the blood glucose level in OLETF-EX was significantly higher than that LETO-SED. There is significantly higher body weight in both OLETF-SED and OLETF-EX animals compare to LETO-SED animals. On the other hand, OLETF-SED animals showed higher body weight than in LETO-EX(Table 1).
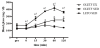
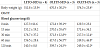
*P<0.05 vs. LETO-SED,
†P<0.05 vs. OLETF-EX.
7.2 Muscle contraction
Results of twitch measurements for MG and SOL muscles are shown in Table 2. There is no significant difference between each experimental group in twitch tensions. When expressed per body weight, however, significantly lower tension in MG muscle of OLETFSED animals than LETO-SED animals. On the other hand, twitch tensions of OLETF-EX animals were preserved. There were no differences in either group of both muscles in TTP and HRT.
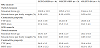
*P<0.05 vs. LETO-SED
†P<0.05 vs. OLETF-EX.
8. Discussion
In present study, there is no significant difference in muscle strength between each group by simple comparison of absolute strength of muscle contraction, although glucose tolerance was improved in OLETF-EX animal. However, we have to take difference of body weight into consideration, because heavy body weight requiring a higher power muscle, on the other hand, low body weight requiring a lower power muscle relatively. Therefore, muscle force per body weight may reflect the actual motor function of each animal. As shown in results, muscle force per body weight was significantly lower in MG muscle of OLETF-SED animals than LETO-SED animals.
In contrast, that of OLETF-EX animals was preserved. The possibility should be considered however, that preserve of muscle force per body weight was not caused by increased / preserved muscle force but resulted from loss of body weight such as decrease of fat etc. Considering the fact there are no significant difference in muscle force per body weight between LETO-SED and OLETF-EX in spite of OLETF-EX remain significant heavier body weight than in LETO-SED, it’s reasonable to consider increased / preserved muscle force has some contribution to preserve of muscle force per body weight. Why only contractile property of MG muscle was altered in diabetic model? This may relate to the fact that decrease of muscle strength predominantly occurred on type II (fast) muscle fibers in diabetic mode [7]. Because, MG muscle fibers are composed of over 90% type II muscle fibers, the strength of MG muscle may subject to diabetes [10]. Add to this, in accordance with previous study, there is no difference in TTP and HRT of each group [7]. Interestingly, effect of exercise training is exact opposite of previous study that report that endurance-exercise training does not prevent or increase muscle weakness in type 1 diabetic rats [8]. This discrepancy may reflect difference of type of diabetes. Compare to OLETF rats, type 1 diabetic model show much higher blood glucose and show an insulin deficiency and ketoacidosis [7,11] . There is no surprise if such a grave diabetic condition, which is quite different from patients receiving treatment for diabetes, contradicts exercise effect. In fact, exercise training improve motor disturbance in diabetic patients [6]. We think, therefore, OLETF rats i.e., type 2 diabetic model, is much closer to the actual situation of diabetic patients. We should be considered, however, that sample number is too small to conclude exercise training prevent decrease of muscle strength. There is a need for further studies using more large number of sample to clarify the effect of exercise on type 2 diabetic model.
9. Conclusion
In summary the present preliminary study has showed possibility that exercise training prevent decrease of muscle strength in type 2 diabetic model. These findings may provide a novel mechanism and treating for deficits in sensorimotor control in diabetic patients.
Competing Interests
The authors declare that they have no competing interests.
Author Contributions
Toru Tamaki: Researched data and wrote the manuscript. Masako Ikutomo, Satomi Arakawa, Junya Komagata: Researched data. Masatoshi Niwa: Contributed to discussion. Ken Muramatsu: Contributed to discussion and reviewed/edited manuscript.
References
- Andersen H, Nielsen S, Mogensen CE, Jakobsen J (2004) Muscle strength in type 2 diabetes. Diabetes 53: 1543-1548 [CrossRef] [Google Scholar] [PubMed]
- Andersen H, Poulsen PL, Mogensen CE, Jakobsen J (1996) Isokinetic muscle strength in long-term IDDM patients in relation to diabetic complications. Diabetes 45: 440-445 [CrossRef] [Google Scholar] [PubMed]
- Andersen H (2012) Motor dysfunction in diabetes. Diabetes/Metabolism Research and Reviews 28: 89-92 [CrossRef] [Google Scholar] [PubMed]
- Petrofsky J, Lee S, Cuneo ML (2005) Gait characteristics in patients with type 2 diabetes; improvement after administration of rosiglitazone. Med Sci Monit 11: PI43-P151 [Google Scholar] [PubMed]
- Uccioli L, Giacomini PG, Monticone G, Magrini A, Durola L, et al. (1995) Body sway in diabetic neuropathy. Diabetes Care 18: 339-344 [CrossRef] [Google Scholar] [PubMed]
- Allet L, Armand S, de Bie RA, Golay A, Monnin D, et al. (2010) The gait and balance of patients with diabetes can be improved: a randomised controlled trial. Diabetologia 53: 458-466 [CrossRef] [Google Scholar] [PubMed]
- Cotter M, Cameron NE, Lean DR, Robertson S (1989) Effects of long-term streptozotocin diabetes on the contractile and histochemical properties of rat muscles. Q J Exp Physiol 74: 65-74 [CrossRef] [Google Scholar] [PubMed]
- Sanchez OA, Snow LM, Lowe DA, Serfass RC, Thompson LV (2005) Effects of endurance exercise-training on single-fiber contractile properties of insulin-treated streptozotocin-induced diabetic rats. J Appl Physiol(1985) 99: 472-478 [CrossRef] [Google Scholar] [PubMed]
- Kawano K, Hirashima T, Mori S, Saitoh Y, Kurosumi M, et al. (1992) Spontaneous long-term hyperglycemic rat with diabetic complications. Otsuka Long-Evans Tokushima Fatty (OLETF) strain. Diabetes 41: 1422– 1428 [CrossRef] [Google Scholar] [PubMed]
- Armstrong RB, Phelps RO (1984) Muscle fiber type composition of the rat hindlimb. Am J Anat 171: 259-272 [CrossRef] [Google Scholar] [PubMed]
- Mansford KR, Opie L (1968) Comparison of metabolic abnormalities in diabetes mellitus induced by streptozotocin or by alloxan. Lancet 1: 670- 671 [CrossRef] [Google Scholar] [PubMed]