


1. Introduction
Occupancy information is useful for building management to operate lighting and ventilation systems with a view to reduce operational cost [1,2]. Furthermore, real-time occupancy monitoring can assume paramount importance during emergency evacuation [3].
Additional equipment and procedures are required to obtain occupancy information in a given space; such equipment may include video cameras, radio-frequency identification tags, and passive infrared sensors. However, these devices can potentially disturb privacy and are limited only to observing certain areas. Carbon dioxide sensors used for indoor environmental monitoring purposes may have better performance in eliminating the aforementioned drawbacks although they have high uncertainty and slow response characteristics.
Therefore, various post-processing methods have been developed to estimate the number of occupants. Mumma [4] used CO2 measurement to determine the number of occupants for variable air volume (VAV) applications. Based on a mass-balance equation for the contaminant, a transient equation was used to accurately detect occupants, and only the steady-state terms were used when the transient method results in oscillation of the estimated occupancy. Methods based on neural networks [5] also work well to estimate the number of occupants but require a large amount of data for the preliminary training phases.
Our aim is to develop a Bayesian method that relies on a mathematical model and does not require a training phase. However, detailed parameters concerning input models such as ventilation rates are required. In this study, the occupancy profiles in rooms with immeasurable ventilation are estimated based upon CO2- concentration profiles. The CO2 concentration profiles obtained over seven days were also used to obtain the appraisal ventilation rate by decay and sum-up methods. We investigate the effect of both the ventilation rate methods upon the estimated number of occupants.
2. Methods
2.1 Model development
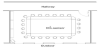
The model space is a seminar room with a total volume of 159 m3. The room is located on the third floor of the engineering building at the Kookmin University. One side of the room’s wall is exposed to the outdoor environment with four operable windows that were kept closed during the measurement. There is no mechanical ventilation system for the room. Adjacent rooms are present on both sides and the hallway is connected to the fourth side of the room, as illustrated in Figure 1.
2.2 Bayesian Markov-chain Monte Carlo (MCMC) approach
The Bayesian MCMC approach is a stochastic simulation technique for computing inferential quantities. According to the Bayesian method, the posterior probability is computed on the basis of the prior probability and the likelihood function is derived from a probability model for the data to be observed. The posterior-distribution relation is given by a combination of the prior distribution and the likelihood as
where π(N) is the prior probability of proposed number of occupants and f(C|N) is the likelihood of observing CO2 given number of occupants. π(N|C) is the posterior probability of the number of occupants. Carbon concentration in the room is generated by the CO2 mass-balance equation as follows:
where V is the volume of the room, m is the CO2-generation rate per person, N represents the number of occupants, Q is ventilationrate, and Cout is outdoor CO2 concentration. The dynamic model as a solution of Eq. (2), which is used to generate the likelihood function, can be expressed as
The concentration at the current time step, Ct, is determined
by the concentration at the previous time step, Ct-Δt and the steady
concentration,
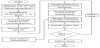
We input the prior information based on the most likely occurrences in the observed system, which should approximate the true values as closely as possible. In this study, the prior of N was uniformly distributed with minimum and maximum levels of 0 and 25 persons, respectively. The remaining prior information was assumed to have a Gaussian distribution. The mean of the prior probability, m, was assumed to be 0.553 g/min, equivalent to sitting with a standard deviation of 30%. We set the mean and the standard deviation of the prior Q according to the measured steady-state-ventilation rate in section 2.3. The means of the prior concentrations of CO2 outdoors and CO2 background is 480 PPM at 5% standard deviation. The MH-MCMC algorithm for each time step is shown in Figure 2. We performed 10,000 iterations to collect 5,000 posterior samples after a burn-in period comprising the first 5,000 iterations.
2.3 Quantification of the ventilation rate
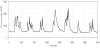
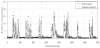
The prior information used to calculate the Bayesian model should be identified with high specificity in order to avoid over- and underestimation. However, some parameters cannot be measured accurately due to uncontrollable characteristics. For instance, there could be difficulties measuring and controlling the ventilation rate in a space without a ducting system. Infiltration takes place through cracks in the walls and windows depending on the outdoor-wind conditions. In this study, the ventilation rate is determined using two methods: the concentration decay method and the sum-up method. Both the methods evaluate CO2 levels with respect to time. CO2 concentration was recorded minutely for seven days during typical weekdays in the observed room. The alteration of CO2 concentration is illustrated in Figure 3.
The concentration decay method is commonly used to measure the ventilation rate by applying a tracer gas technique [6]. We utilize the CO2 naturally generated by humans as a tracer gas. The ventilation rate is estimated by analyzing the concentration decay rate at the end of each day.
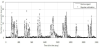
The space concentration decays down to the background concentration after unoccupied time due to dilution of outdoor concentration. Assuming that the space concentration is mixed uniformly and the ventilation rate is constant, the exponential decay from Figure 4 can be observed. The decay concentration is normalized from the observed period as
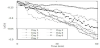
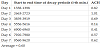
where CO is the initial concentration at the start of the decay observation period. The log-normalized concentration during the selected period is illustrated in Figure 4. The slopes of linear fitting in the figure represent the air-exchange rates summarized in Table 1. The steady-state-ventilation rate can be obtained by averaging the seven observed air-exchange rates and then multiplying the result by the given space volume. The calculated ventilation rate was defined to have 0.60 ACH (1.6 ±0.74 m3/min) with a standard deviation of 0.74 m3/min or 46% of the mean.
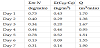
The sum-up method integrating total CO2 generation rate and number of occupant over the concentration deference between indoor and outdoor as formulated in Eq. 5. A summary of the appraised ventilation rates obtained by the sum-up method is shown in Table 2. The average of ventilation rate is 1.52 m3/min and the standard deviation is 0.30 m3/min or 20% from the mean:
3. Occupancy Estimation
Each ventilation rate appraisal is used as a prior input for Bayesian estimation. The mean values of Q obtained from the decay and sumup methods are similar, but the standard deviation between them has a large difference. The occupancy estimation using the Q prior of the decay method is shown in Figure 5. A wide standard deviation in the Q prior produces severe fluctuation in the occupation time. Figure 6 shows occupancy estimation using the Q prior according to the sumup method. Estimation with this method fluctuates less compared to the decay method. Error estimates using the Q priors of the decay and sum-up methods are 138% and 130%, respectively. The high error shown by both methods may result from variation of the ventilation rate at each time step. However, both methods produce highly valuable information concerning space-ventilation characteristics and the estimation profile also showed good agreement with the real occupancy schedule.
4. Conclusion
Occupancy estimation based on the measured CO2 concentration has been successfully conducted using the Bayesian MCMC approach. The CO2-concentration profile is also used to quantify the ventilation rate by the concentration decay and sum-up methods. The mean and standard deviation obtained from seven samples of ventilation measurement are used as the input priors for the Bayesian MCMC. Wide standard deviations of the ventilation rates measured using the decay method reduce the accuracy of Bayesian estimation through severe fluctuations and a narrow standard deviation produced by the sum-up method can offset the estimation. Quantification of the ventilation rate using the concentration decay and sum-up approaches produces reasonable Bayesian estimation results with similar error values.
Competing Interests
The authors declare that they have no competing interests.