


1. Introduction
The intensity of solar radiation may be not “in-phase” with the energy demands in a considerable number of solar energy applications. The resulting shortage-surplus problem, which may be encountered in a seasonal, daily or even hourly level, can be remedied by the various energy storage techniques, applied in the active or passive mode.
With reference to building applications, among the numerous storage techniques , a promising one is the use of Phase Change Materials (PCM). These may store considerably greater amounts of heat than those stored in liquid or solid materials owing to the extra heat absorbed or released during phase change (latent or phase change heat) [1]. For building applications, the properly designed use of PCM, under favourable conditions and right temperature levels may increase up to five times (in case of organic PCM) or even up to ten times (in case of inorganic PCM) storage capacity or decrease storage space accordingly [2].
The optimum building energy management based on the startling developments of technology requires changes in building design, which often lead to objectionable constructions, from the aesthetics and architectural point of view. Here, PCM may offer an excellent solution as they are invisible, hidden within construction elements, from where they may absorb or release considerable amount of heat.
Other PCM applications in buildings are related to the non-inphase thermal needs among various building departments, arising from their different use, orientation or construction. Thermal energy released or absorbed from such departments may be used, after storage in PCM, for heating or cooling other parts of the building, thus providing considerable energy savings.
Purpose of the present study is the development of a prediction procedure for passive PCM solar applications in buildings and the use of results in solar energy management along the typical year in the Athens area. The solar radiation and ambient temperature values used were obtained by statistical processing of related hourly measurements corresponding to more than 20 years [3-4]. The required thermal properties of PCM employed in our calculations were measured using a developed technique [5], which is an improved version of the wellknown T-history Method [6]. The effect of the main PCM parameters is examined, i.e. phase change temperature range, phase change heat, PCM location, quantity and way of embodiment into construction elements, etc. In all cases the hourly, daily, monthly and yearly energy savings are calculated. Such information was not so far available for the Athens area. Therefore, the engineer has now more data for obtaining the optimum result. The conclusions of the study may be applied to any region with climate similar to that of Athens and, because of their generality, most of them may be useful to any climate.
Classifications of inorganic (salt hydrates) and organic (paraffins, microcrystalline waxes, fatty acids, esters, fatty alcohols) PCM together with their advantages and disadvantages may be found in [7,8] among others. Related reviews of PCM applications in buildings, starting from 1920, may be found in [1,8,9], among others.
2. Thermal Behavior Prediction off Buildings Containing PCM
2.1 General
Heat transfer prediction in PCM is considerably more complicated than that in materials remaining in the same phase during the process of interest, for the following reasons:
- Phase change is not a linear problem.
- Mushy zone, in which phase change takes place, does not have distinct boundaries, with the exception of some materials with phase change under practically constant temperature.
- During melting, natural convection may cause detachment and then movement of solid material within the liquid phase, while during solidification, cavities may result within solid phase, owing to volume changes.
- Convection heat transfer may take place within liquid and mushy regions. However, the estimation of convection coefficient is difficult.
To overcome the above difficulties, the following main assumptions and approximations are made in the present study, which simplify the simulation procedure considerably:
- Relations for the calculation of convection coefficients have been proposed in some basic or very simple cases, as for example for PCM contained between two parallel plates [10]. However, in the present work convection heat transfer is neglected,as it happens in most related studies [11-12].
- PCM properties are accurately known in the solid and liquid phases. For the mushy region various functions have been tested, based on our measurements [5], as described later.
- Volume change and possible cavity formations are neglected.
Numerical techniques are good tools for heat transfer predictions in buildings with embodied PCM. In the present work the Finite Difference Method has been selected. However, a model for the simulation of phase change is needed. The main models developed for this purpose include:
- The Enthalpy Method [10], which is based on a numerical solution of the enthalpy transport differential equation. It is suitable for predicting details of the phase change process, as for example is the movement of the solid-liquid interface.
- The Effective Thermal Capacity Method [11-12], which is the most easily applied, as it follows the usual numerical solution process of the energy transport differential equation, with PCM thermal capacity during phase change being a function of temperature usually called “the effective thermal capacity function Cp,eff (T). The only difficulty of the method is the choice of the proper function Cp,eff (T).
In the thermal behavior analysis of buildings containing PCM, phase change is interesting only as a macroscopic phenomenon, i.e. details like movement of the liquid-solid interface or the spreading of the mushy zone, are not a primary interest. Therefore, in the present study, the effective thermal capacitance model has been selected, as the simplest way for the simulation of phase change in conjunction with the finite-difference method. The Cp,eff(T) functions for the PCM used have been derived as described in the following section.
2.2 Measurements and estimation of effective thermal capacity function Cp,eff(T)
The data needed for deriving simple Cp,eff(T) functions are the PCM phase change heat, H, and the solid and liquid PCM temperatures, Ts and Tl, as well as the corresponding heat capacities Cps and Cpl, respectively, at the ends of PCM two phase region.
The following four different Cp,eff(T) functions of simple geometrical shape have been tested:
(a) Triangular function The analytical expression for line segment 12 (Figure 1a) may be written
[Cp,eff(T) - Cps] / (T - Ts) = (Cpmax- Cps) / (Tc – Ts)
where Tc = (Tl+Ts)/2 is the temperature at the middle of the PCM phase change temperature width and Cpmax is the value of Cp,eff at T=Tc. The area H/2 below line segment 1 2 may be expressed as:
H/2 = (Cpmax + Cps) (Tc - Ts)/2
Substitution of Cpmax from Eq.(2) to Eq.(1) gives the Cp,eff(T) function for Ts ≤T ≤Tc, i.e.
Cp,eff(T) = 4(H - bCps)(T - Ts)/b2 + Cps
where b = Tl – Ts is the temperature width of PCM phase change.
The Cp,eff(T) function for Tc T Tl is derived similarly, i.e. :
Cp,eff(T) = 4(bCpl- H)(T -Ts - b/2)/b2 + 2H/b - Cpl
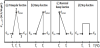
(b) Ramp function
The expression for Cp,eff(T) function of a ramp shape (Figure 1b), which is derived in a similar way as above, is
Cp,eff(T) = 2 (H - bCps) (T - Ts)/b2 + Cps, Ts ≤T≤Tl
(c) Reversed ramp function
Here, the Cp,eff(T) function becomes (Figure 1c)
Cp,eff(T) = 2(bCpl - H) (T - Ts) / b2 + (2H/b - Cpl), Ts ≤T ≤Tl
(d) Step function
Here, it is obvious that (Figure 1d)
Cp,eff(T) = H/b, Ts ≤T ≤Tl
For the experimental derivation of the effective heat capacity function Cp,eff(T) for PCM suitable for passive building applications, measurements have been performed using a developed and constructed measurement arrangement with a corresponding measuring procedure, as described in detail in [5]. The whole system is an improved version of the well-known and widely used T-history method [6]. Briefly, two glass tubes containing liquid PCM and reference fluid, respectively, are cooled within a controlled environment test chamber of constant temperature Ta < Ts until the complete PCM solidification (Figure 1.1). The PCM and reference fluid temperatures Tm,k and Tr,k , respectively, are measured during the cooling process at any time tk , with a time step (tk+1–tk) (Figure 1.2). The effective thermal capacity corresponding to temperature T= (Tm,k + Tm,k+1)/2 is calculated from equation:
with a time step (tk+1–tk) (Figure 1.2). The effective thermal capacity corresponding to temperature T= (Tm,k + Tm,k+1)/2 is calculated from equation:
Cp,eff(T)=M (Tr,k-Tr,k+1)(Tm,k+Tm,k+1-2Ta)/ (Tm,k-Tm,k+1)(Tr,k+Tr, k+1-2Ta) – N
where,
M = (mtrCptr + mrCpr)Stm/ mmStr
N = mtmCptm / mm
In the above equations mtm, Cptm and Stm are the mass, heat capacity and exterior surface of the tube containing PCM, while mtr, Cptr and Str are the corresponding quantities for the tube containing reference fluid; mm and mr are the PCM and reference fluid mass, respectively, and Cpr is the reference fluid heat capacity.
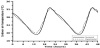
All experiments made showed a triangular shape of Cp,eff(T). Two examples are given in Figure 2 for (a) Paraffin of Rubitherm Company under trade name RT35 [13], and (b) usual Greek market paraffin. Comparisons made using the exact Cp,eff(T) function given by Eq. (8) and the triangular Cp,eff(T) given by Eqs. (3) and (4) gave negligible differences in the final results. Therefore, in our calculations, the triangular Cp,eff(T) equations were used, with the property values H, Ts, Tl, Cps and Cpl taken from the corresponding experiments.
2.3 Differential equations and numerical solution procedure
2.3.1 Exterior walls or roof
The instantaneous temperature Tej(t,x) of any layer j of envelope element e (i.e. wall, roof, etc.) at time t and depth x, measured from the outdoor surface, may be expressed by the transient one-dimensional heat conduction equation
ρejCej ∂Tej(T,x) / ∂t = kej∂2Tej(t,x) / ∂x2 , xj < x < xj+1 , j = 1, 2, …,J
where J is the number of layers each element is composed of; ρej, Cej and kej are the density, thermal capacity and thermal conductivity of the jth layer of element e, respectively, and xj, xj+1 are the coordinates of the jthlayer surfaces. For the PCM layer,Cej is taken equal to the triangular effective thermal capacity function Cp,eff(T), given in the previous section.
The boundary and initial conditions for differential Eq. (11) may be written as
qo,e(t) = ho[To(t) – Te1(t,x)] , x = x1
qi,e(t) = hi[Tej(t,x) – Ti(t)] + Σuge,u[Tej(t,x)-Tu(t)], x = xJ+1
Tej(t,x) = Bej(x), xj ≤x≤ xj+1, j = 1,2,…,J, t = 0
Where Ti(t), qi,e(t) and hi are the indoor air temperature, the heat flow and the convective heat-transfer coefficient at interior surface of exterior wall e, respectively, while To(t), qo,e(t) and ho denote the corresponding quantities for the outdoor surface; ge,uis the radiation heat-transfer factor between interior surface of envelope element e and any other indoor surface u of temperature Tu(t); and Bej(x) denotes the initial temperature field at jth layer of element e.
The incident solar radiation GT is taken into account by using the equivalent outdoor temperature or sol-air temperature concept [14], i.e
To(t) = Tamb(t) + αGT/ho – L
where Tamb(t) is the real ambient temperature, αis the exterior wall absorption coefficient for the incident solar radiation GT and L expresses wall radiation losses, as analyzed in [14].
If there is a fenestration opposite to the indoor surface of an exterior wall, the term R(t) given by Eq.(17), should be included in Eq.(13).
2.3.2 Interior walls (partitions)
The transient one-dimensional heat conduction in the interior walls is expressed by equation similar to Eq.(11), with boundary conditions at both sides of the interior wall written as:
qp(t) = hi[Tp(t,x) – Ti(t)] + R(t) + Σugp,u[Tp(t,x) – Tu(t)]
where Tp(t,x) are the surface temperatures of both sides of indoor wall (i.e. for x=x1 and x=xJ+1). The above boundary conditions include heat exchange by convection with coefficient hi and absorption of solar radiation R(t) from opposite fenestrations, which is expressed as
R(t) = τ(1-d)αGT(t)Ff/Fw
2.3.3 Effect of furnishings
Indoor furnishings are simulated by equivalent wooden slabs. The transient one-dimensional heat conduction within these slabs and the related boundary conditions are of the same form as the equations for interior walls with obvious changes.
2.3.4 Indoor thermal energy balance equation
The differential equation set comprising all the above equations for the exterior walls, interior walls and furnishings is closed by the indoor thermal energy balance differential equation:
ρavaCa∂ Ti(t)/∂t = Σeqi,e(t)Ae+[qp1(t)+qpJ(t)]Ap+[qf1(t)+qf2(t)]Af+Qi(t)
Ti(t) = Ti,b , t=0
where ρa, va, Ca are the density, volume and thermal capacity of indoor air, respectively; the summation refers to the e elements (walls, roof, fenestration, etc.) of building envelope with corresponding heattransfer surfaces Ae (e=1,2,…); Ap and Af are the total heat-transfer surfaces of the interior walls (partitions) and equivalent furniture slabs, respectively, with corresponding heat flows at the two sides (qp1, qpJ) and (qf1, qf2); Qi(t) is the total indoor load resulting by lighting, equipment, people, ventilation and infiltration, solar radiation absorbed by the indoor air, etc.; and Ti,b stands for the initial indoor temperature.
2.3.5 Finite-difference solution and documentation
Solution of the set of differential equations outlined above is obtained by a usual finite difference technique. Results of the developed procedure were in good agreement with measurements in a test chamber, as will be presented in detail in a forthcoming publication. The procedure was applied to study the effect of solar radiation in Athens buildings using PCM, as the passive storage medium, as described in the following section.
3. Results
The study of thermal behavior of buildings containing PCM is made by making interventions (i.e. addition of PCM) to the conventional (i.e. without PCM) “Typical Greek House” (TGH) defined as follows:
- Detached one-storey house.
- 100 m2 floor area of square shape.
- Exterior walls and roof composition given in Table 1.
- Indoor walls of 30m lenGTh made of single bricks with finishing layers on both sides.
- The four sides of the house are oriented towards the four main orientations and each one is composed of 25% fenestration with overall heat transfer coefficient 3.2 W/m2 K.
- Outdoor and indoor convection coefficients 16 W/m2 °C and 8 W/m2 °C, respectively.
- Light-coloured exterior envelope surface with absorption coefficient for solar radiation 0.44.
The following assumptions and data have been used for the simulation of buildings thermal behavior:
- Solar radiation and ambient temperature values for the Athens area, obtained by statistical processing of related hourly measurements corresponding to more than 20 years [3,4].
- Initial building and indoor air temperature 20°C.
- Constant ventilation of 2 indoor air changes per hour.
- No indoor heating or cooling apparatus (i.e. passive system).
- Floor is considered adiabatic.
- Paraffins of various properties have been used as PCM.
- The effective thermal capacitance model has been used for the simulation of phase change, with triangular functions Cp,eff(T), as a good approximation to measurements made in the specific paraffins.
The effect of the following parameters has been studied:
- PCM phase change temperature range.
- PCM phase change heat(kJ/kg).
- PCM layer thickness (mm).
- Location of the PCM layer, i.e. in an exterior or interior wall. In case of exterior wall with insulation, PCM may be located toward either the outdoor or the indoor wall surface with reference to the insulation layer.
- Way of PCM embodiment into an interior wall (i.e. PCM layer between brickworks, plaster-boards, etc.).
- Thickness of insulation layer.
- Effect of replacement of an insulation layer by a PCM layer.
Combinations of the above parameters may result in thousands of cases, most of which have been studied in the present work. The most important of these, which exhibit considerable practical interest, are presented below:
3.1 Effect of adding PCM either to the exterior or to the interior walls
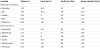
Figure 3(a) compares the following two cases:
- A 50 mm PCM layer (150 kJ/kg phase change heat, 24°C -30°C phase change temperature range) is added next to the indoor side of the insulation layer in the TGH exterior walls. Interior walls remain unchanged.
- A 50 mm PCM layer with the same properties, as above, is added to the interior walls of the TGH, which now consist of a central PCM layer with 90 mm brickworks and finishing layers on both sides. Exterior walls remain unchanged.
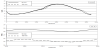
Although Figure 3(a) provides a whole view of the indoor temperature in terms of the hours along the Athens typical year, details as, for example, the daily temperature variations or the differences between the two curves are not distinguishable. For this reason, a part of the two curves corresponding to the day with the maximum differences between the two cases, during the summer, is given in Figure 3(b). In this figure it is seen that during the summer, PCM in the indoor wall absorbs solar heat coming through any opposite fenestration, thus keeping the indoor temperature lower up to 4°C.
Calculations for the same conditions as above but using a PCM with different phase change temperature (17°C-23°C) have also been made with similar results, i.e. the maximum indoor temperature difference ≅ here is 2.3°C.
It is concluded that considerable energy saving is obtained by adding a PCM layer to the interior walls, which absorb solar radiation coming through any opposite fenestration.
If PCM is located at the outdoor side of the exterior walls insulation, its loading from the outdoor solar radiation is feasible but the insulation prevents heat exchange with indoor environment.
If PCM is located at the indoor side of the exterior walls insulation, the latter, prevents PCM loading by the outdoor solar radiation, but considerable energy profits is possible if an opposite fenestration exists, which will allow PCM loading by the incoming solar radiation. Moreover, PCM may exchange heat resulting from various indoor loads (i.e. lighting, equipment, people, etc.), thus smoothing out indoor temperature variation. Therefore, if it is desired to add PCM into the building envelope, its placing at the indoor side of insulation is preferable.
3.2 Effect of the phase change temperature range of PCM located into the interior walls
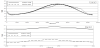
In Figures 4a and Figure 4b, which have the same format as Figure 3a and FIgure 3b, the following three cases are compared:
- A 50 mm PCM layer (150 kJ/kg phase change heat, 17°C-23°C phase change temperature range) is added to the interior walls of the TGH, which now consist of a central PCM layer with 90 mm brickworks and finishing layers on both sides. Exterior walls remain unchanged.
- As above, but with 20°C-26°C phase change temperature range.
- As above, but with 27°C-33°C phase change temperature range.
It is concluded that considerable energy saving is obtained by adding PCM to the interior walls, which absorb solar radiation coming through any opposite fenestration. The effect of the phase change temperature range is also considerable and therefore the choice of the proper range is critical. It is interesting that the proper ranges, which maximize savings, are different for summer and winter. Therefore, different ranges should be selected for the summer-house, the winter-house and the whole-year-house.
As shown in Figure 4a and Figure 4b, the highest energy savings are obtained by using phase change temperature ranges 17°C – 23°C, 20°C – 26°C and 27°C – 33°C for spring, start of summer and end of summer, respectively. For the winter it was found that the 20°C – 26°C and the 17°C – 23°C ranges give the highest and lowest indoor temperatures, respectively, and therefore the 20°C – 26°C range should be selected for the winter house.
The same conclusions apply when PCM is located at the indoor side of insulation in exterior walls opposite fenestration.
3.3 Effect of the phase change heat of PCM located into the interior walls
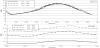
Figure 5a and Figure 5b compare, in the usual format, the following two cases:
- An 100 mm PCM layer (150 kJ/kg phase change heat, 20°C- 26°C phase change temperature range) is added to the interior walls of the TGH, which now consist of a central PCM layer with 90 mm brickworks and finishing layers on both sides. Exterior walls remain unchanged.
- As above but with 200 kJ/kg PCM latent heat.
It is concluded that if PCM is located into interior walls with opposite fenestration, considerable energy saving is obtained by increasing the value of phase change heat. However, further predictions showed that the phase change temperature range is a more important parameter than the phase change heat.
The same conclusions apply to exterior walls opposite fenestration, with the PCM layer located at the indoor side of insulation.
3.4 Effect of the layer thickness of PCM located into the interior walls
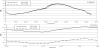
Figures 6a and Figure 6b compare, in the usual way, the following two cases:
A 50 mm PCM layer (150 kJ/kg phase change heat, 20°C - 26°C phase change temperature range) is added to the interior walls of the TGH, which now consist of a central PCM layer with 90 mm brickworks and finishing layers on both sides. Exterior walls remain unchanged.
As above but with 100 mm PCM layer.
From Figures 6a and FIgure 6b it is concluded that considerable energy saving may be obtained by increasing the PCM layer thickness in interior walls opposite fenestration. Similar is the effect if PCM layer is located at the indoor side of insulation in exterior walls opposite fenestration.
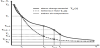
3.5 Effect of insulation thickness in the exterior walls
For evaluating and comparing the roles of PCM and insulation, the indoor air temperature in terms of the hours along the Athens typical year was predicted for TGH (i.e. with 50 mm insulation thickness) and for insulation thickness increased to 100 mm.
It was found that the effect of doubling the insulation thickness is not impressive, i.e. the maximum indoor air temperature difference along the typical year is 0.7°C, which corresponds to 13% maximum energy savings.
3.6 Effect of replacing insulation by a PCM in the exterior walls
- TGH
- TGH in which insulation is replaced by a PCM layer of 50 mm thickness, 150 kJ phase change heat and 17°C – 23°C phase change temperature range.
- As above but with 24°C – 30°C phase change temperature range.
The predictions show that for the Athens summer, in the absence of opposite fenestration, the effect of replacing insulation by a PCM in the exterior walls is similar to that of doubling the thickness of insulation layer, i.e. 10% energy saving with indoor temperature drop 0.5°C for the case of 17°C – 23°C phase change temperature range. The corresponding results for the case of 24°C – 30°C phase change temperature range are 5% and 0.3°C, respectively. For the Athens winter, the profit is negligible in both cases.
3.7 Effect of the phase change temperature range of PCM located in the exterior walls
The following two cases are compared:
- A 20 mm PCM layer (150 kJ/kg latent heat, 17°C-23°C phase change temperature range) is added next to the indoor side of the insulation layer in the TGH exterior walls. Interior walls remain unchanged.
- As above, but with 24°C-30°C phase change temperature range.
The predictions show that, in the absence of opposite fenestration, differences in phase change temperature range have negligible effect when PCM is located in the exterior walls at the indoor side of the insulation layer (maximum indoor temperature difference ≅ 0.2°C). Equally negligible is the effect when PCM is located at the outdoor side of insulation. Here, it is verified that, in the absence of opposite fenestration, the combination of insulation with PCM in the exterior walls holds the known profits of the insulation but decreases PCM benefits.
3.8 Effect of PCM location either at the indoor or at the outdoor side of the insulation in the exterior walls
The following two cases are compared:
- A 50 mm PCM layer (150 kJ/kg phase change heat, 20°C-26°C phase change temperature range) is added next to the indoor side of the insulation layer in the TGH exterior walls. Interior walls remain unchanged.
- As above, but with the PCM layer located next to the outdoor side of the insulation layer.
The predictions verify that, in the absence of opposite fenestration, in both cases, the changes in the thermal behavior of the house are negligible along the entire typical year in Athens (maximum indoor temperature difference ≅ 0.2°C).
3.9 Effect of locating PCM either between brickworks or between plaster-boards in the interior walls
The following two cases are compared:
- A 100 mm PCM layer (150 kJ/kg phase change heat, 24°C-30°C phase change temperature range) is located into the interior walls of the TGH, which now consist of a central PCM layer with 90 mm brickworks and finishing layers on both sides. Exterior walls remain unchanged.
- As above but with the brickworks and finishing layers replaced by 12 mm plaster-boards on both sides of the PCM layer.
The predictions show that, as expected, light construction elements (i.e. plaster-boards) are superior to conventional (heavy) ones (i.e. brickwork) as the former enable PCM to “feel” faster the temperature variations of the indoor air and the incident solar radiation through fenestration.
3.10 Effect of the phase change heat of PCM located into the exterior walls
The following cases are compared:
- A 50 mm PCM layer (150 kJ/kg phase change heat, 24°C - 30°C phase change temperature range) is added next to the indoor or outdoor side of the insulation layer in the TGH exterior walls. Interior walls remain unchanged.
- As above but with 200 kJ/kg PCM phase change heat.
The predictions show that, in the absence of opposite fenestration, if PCM is located into the exterior walls, in any side of the insulation, the effect of its phase change heat is negligible along the entire typical year in the Athens area (indoor temperature difference ≅ 0.1°C).
3.11 Effect of the layer thickness of PCM located into the exterior walls
The following cases are compared:
- A 20 mm PCM layer (150 kJ/kg phase change heat, 20°C - 26°C phase change temperature range) is added next to the indoor or outdoor side of the insulation layer in the TGH exterior walls. Interior walls remain unchanged.
- As above, but with 50 mm PCM layer thickness.
The predictions show that, in the absence of opposite fenestration, if a PCM layer is located into the exterior walls, in any side of the insulation, the effect of its thickness is small along the entire typical year in the Athens area (maximum indoor temperature difference ≅ 0.3°C).
4. Conclusion
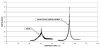
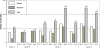
A numerical procedure was developed for the simulation of PCM passive systems in buildings, using the effective thermal capacity model. The developed procedure was used to predict and analyze the effect of main PCM parameters during its operation as a passive system, without the use of heating or cooling apparatus in the Athens area. The findings, presented in Section 3, are gathered in a compact form in Figure 7, which shows in a bar graph format some of the most interesting cases, i.e.:
CASE A Increase of insulation thickness of exterior walls from 50 mm to 100 mm.
CASE B Replacing insulation of exterior walls by a PCM layer of 50 mm thickness, 150 kJ/kg phase change heat and 17 – 23°C or 24 – 30°C phase change temperature range.
CASE C A 50 mm PCM layer with 150 kJ/kg phase change heat and 17 - 23°C, 20 -26°C, 24 - 30°C or 27 - 33°C phase change temperature range is added to the interior walls, opposite fenestration.
CASE D A 100 mm PCM layer with 150 kJ/kg phase change heat and 20 - 26°C or 27 - 33°C phase change temperature range is added to the interior walls, opposite fenestration.
CASE E Energy demand of the conventional TGH in Athens, as defined in Section 3, i.e. without interventions.
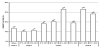
The three bars in each case of Figure 7 correspond to the energy savings (in kWh) obtained by making interventions to the conventional TGH during the heating period, the cooling period and the whole typical year in Athens, respectively. It is seen that, for the Athens TGH, energy savings up to 1236 kWh/year may be obtained by adding PCM layers with the right properties into walls opposite fenestration. For each case of Figure 7, the percentage of the energy profit, with reference to the conventional TGH, is presented in Figure 8, which shows profits up to 33%.
According to the analysis presented, the main conclusions may be summarized as follows:
- Our predictions proved that the shape of the effective thermal capacity curve Cp,eff(T) has considerable effect on the final results. Therefore, experimental determination of the Cp,eff(T) function was necessary, which suggested a triangular shape of Cp,eff(T) for various PCM suitable for passive applications in buildings. Comparisons made using the measured and the simple triangular Cp,eff(T) functions gave negligible differences in the final results.
- Solar radiation is the most important parameter which brings PCM into action during its operation as a passive system.
- The energy saving obtained by replacing the insulation of the exterior walls by a PCM is lower than expected. The gain is similar to that of doubling the thickness of the insulation layer (≈ 10%).
- Placing a PCM layer at the outdoor side of the exterior walls insulation offers negligible profit as the later obstructs PCM in the exchange of heat with the indoor environment (i.e. stored solar heat cannot be transferred indoors).
- Considerable energy profit is obtained by placing a PCM layer at the indoor side of the exterior walls insulation, provided that there is opposite fenestration, which allows PCM loading by the incoming solar radiation. It opposite fenestration does not exist, there is no solar radiation profit, as the insulation layer obstructs PCM in the heat exchange with the outdoor environment (i.e. loading by solar radiation). However, there is exchange of heat resulting from various indoor loads (i.e. lighting, equipment, people, etc.) with the beneficial consequence of smoothing out the indoor temperature variation.
- From (d) and (e) it is concluded that if it is desired to add a PCM layer into the building envelope, its placing at the indoor side of the insulation is clearly preferable.
- Considerable energy saving is obtained by adding PCM to interior walls opposite fenestration. This is due to solar radiation, which is transmitted through fenestration and then absorbed by the interior walls, where it is stored and released later into the indoor environment. Apart from storing incoming energy, PCM in the interior walls also operate as a damping system for any steep indoor temperature variation.
- PCM layers located at interior walls or at the indoor side of exterior wall insulation opposite fenestration, may obtain considerable energy saving by increasing the layer thickness or the value of latent heat, as expected. However, the phase change temperature range exerts a stronger influence than the value of the latent heat. The optimum range, which maximizes energy saving, differs for the summer and winter periods and therefore the engineer should select the PCM with the proper phase change temperature range, according to the use and the needs of any specific building. Also, the engineer should select, where possible, light construction elements (i.e. plaster-boards) instead of the conventional (heavy) ones (i.e. brickwork) to embody PCM layer, as the former will enable PCM to “feel” faster any thermal change.
- PCM properties and layer thickness have negligible effect if PCM layer is located at the outdoor side of exterior walls insulation.
- The ambient temperature and solar radiation values of the Athens area have been used in our calculations. Therefore, all the above conclusions are applicable to Athens and to regions of a similar climate. As most of the conclusions are general, they may be useful to regions of any climatic conditions.
- We conclude this study by noting that PCM may offer an excellent solution to the energy saving of buildings without creating aesthetic or architectural objections, as PCM are invisible, hidden within walls, from where they operate as a passive system by absorbing and releasing considerable amounts of heat.
Competing Interests
The authors declares that there is no competing interests regarding the publication of this article.
Author Contributions
All the authors substantially contributed to the study conception and design as well as the acquisition and interpretation of the data and drafting the manuscript.
Nomenclature
A Area (m2)
B Initial temperature field (K or 0C)
b Temperature width of PCM phase change
Cp or C Thermal capacity (J/kg K)
Cp,eff Effective thermal capacity (J/kg K)
d Part of solar radiation absorbed by indoor air and any other obstable
Ff, Fw Areas of fenestration and opposite wall, respectively (m2)
GT Incident total solar radiation (W/m2)
g Radiation heat-transfer factor (W/m2K)
H Phase change heat (KJ/kg)
h Convection heat transfer coefficient (W/m2K)
k Thermal conductivity (W/mK)
L Normalized Radiation Losses (K or 0C)
M Quantity defined by Eq.(9)
m Mass (kg)
N Quantity defined by Eq. (10)
Q Indoor load (W)
q Heat flow (W/m2)
R Absorbed solar radiation by a wall (W/m2)
S Exterior tube surface (m2)
T Temperature (K or oC)
To Equivalent outdoor temperature (K or 0C)
Tl , Ts Temperatures at the ends of two-phase region (K or 0C)
Tm, Tr PCM and reference fluid temperatures, respectively (K or 0C)
t Time (s)
U Overall heat transfer coefficient of a wall or rood (W/m2K)
v Volume (m3)
x Cartesian coordinate (m)
Greek symbols
α Absorption coefficient for incident solar radiation
ρ Density (kg//m3)
τ Fenestration transmission coefficient for solar radiation
Subscripts
a Refers to air
amb Refers to the ambient
b Refers to initial condition (t=0)
c Refers to the middle of PCM phase change temperature width
e Element of buildings envelope
f Refers to furniture
i Indoor
J Number of wall layers
j Wall layer
k , k+1 Refer to the time step (tk+1 – tk)
l Refers to liquid state
m Refers to a PCM
max Refers to a maximum value
o Outdoor
p Refers to indoor walls (partitions)
r Refers to a reference fluid
s Refers to solid state
t Refers to tube
u Refers to an indoor surface