


1. Introduction
Aluminum 2024-T3 (Al2024-T3) alloy is one of the most widely used aluminum alloys in the aerospace industry due to its relatively low weight, high strength and fatigue resistance. Typical uses of Al2024-T3 include fuselage and wing skins, cowls and internal structures. A major disadvantage of Al2024-T3 is its low corrosion resistance; hence, in aerospace applications, it is used after an anodizing treatment followed by sealing with epoxy paints/coatings [1,2]. Moreover, the anodization process enhances the adhesion between the aluminum substrate and the epoxy coating, however, due to electrical conductivity mismatches, in the event of a coating failure (scratches), aluminum corrosion can initiate and proceed notably fast leading to catastrophic failures [3].
In order to further enhance adhesion and alleviate the mismatches, several studies have been conducted on nano-modified epoxies employing mainly graphitic structures like carbon nano tubes (CNTs) [4-8]. Apart from the improved adhesion, CNTs can also reduce the ingress of water in the epoxy due to their hydrophobic nature and the water affected specific area resulting in more tortuous paths for the absorption and diffusion of water, thus, further enhancing the performance of the joint structure [9-11]. In addition, the CNTs can significantly enhance the electrical conductivity of the insulating epoxy, thus abating the conductivity mismatch between aluminum substrate and coating. A recent approach on epoxy resins reinforcement is via the inclusion of multiple filler types like amorphous graphite (AG) or graphene, in order to exploit synergistic effects between the fillers. When the different fillers belong to various scale sizes, it is possible to even exploit synergistic effects further enhancing performance and material properties [12-14]. In this study, AG is combined with CNTs, with the objective to explore such synergistic effects that could further improve the corrosion protection of the aluminum substrates.
In an event of corrosion initiation, an early indication could prevent catastrophic failures. Recently, many research efforts have been focused on non-destructive (NDT) on line inspection techniques that can characterize and monitor aluminum corrosion phenomena [15,16]. One of the studied techniques is that of Acoustic Emission (AE), which can monitor transient elastic propagating waves caused by a rapid release of energy within a material under stress[17,18]. ΑΕ has already been extensively employed in a wide range of engineering materials like metallic alloys [19-21], fiber reinforced polymers (FRPs) [19,22], reinforced concrete [23,24]. Recently, efforts on AE as a corrosion monitoring technique for steel alloys have been presented with promising results. Different corrosion phenomena, like intergranular corrosion [25], uniform [26,27], localized or pitting corrosion [21], have been successfully correlated with specific AE indices. A specific, for the aviation sector, advantage of AE as a corrosion monitoring technique, is that AE can also provide information on the structural integrity of FRPs which gradually are replacing traditional metallic alloys [28,29]. Thus, AE is emerging as a “multi-purpose”-on line monitoring tool leading to reduced costs of inspection.
Based on the aforementioned considerations, in this study open circuit and cyclic polarization tests were coupled with AE measurements. One of the major indicators of aluminum corrosion is the formation of hydrogen as a by-product of aluminum oxide development. The coupled measurements were targeted on identifying changes in specific AE indices that could be associated with the creation of hydrogen bubbles. The employed aluminum specimens were either as-received, anodized or coated with neat and modified with carbon allotropes (i.e. carbon nano tubes (CNTS), amorphous graphite (AG) and combination (Ternary)) epoxies, so as to differentiate between water vapor bubble phenomena and corrosion phenomena (general corrosion, pitting corrosion etc.) and correlate these phenomena with characteristic AE signal descriptors.
2. Materials
In this study, Al2024-T3 alloy substrates were used in the asreceived, anodized and epoxy coated states. The as-received state entails that the aluminum substrates had been sand-blasted and ultrasonically cleaned prior to electrochemical testing. However, given the fact that oxidation of the aluminum surface spontaneously occurs in the presence of the atmospheric air, it is expected that the as received substrates had a very thin (nanoscale) surface alumina-based film prior to the measurements. In the anodized state, as-received specimens were surface treated according to ASTM D 3933 without the surface sealing step, and then tested, in order to simulate a “failure type” scenario, where a protective coating is ruptured exposing the underlying anodization film. In the epoxy coated state, anodized specimens were further coated with a series of epoxy coatings. As previously stated, the epoxy coatings were as-received (neat) epoxy and reinforced with CNTs, AG and Ternary at 0.5%, 2.0 and 0.5-2.0% w.w. respectively.
The epoxy resin that was used for the neat and modified coatings, was a two part low viscosity epoxy resin (Araldite 5052 resin and Aradur 5052 hardener) provided by Merkouris SA. According to the manufacturer, a typical curing cycle consisted of curing at 230C for 24 h and post curing at 1000C for 4 h.
Graphistrength C100 multi walled carbon nano tubes (CNTs) MWCNTs provided by Arkema, France, and graphitie (GR) (i.e. mixture of graphite particles and chopped micron scaled carbon fibers at a 1/1 ratio), provided by R&G Composites, Germany, were selected as the reinforcing phases for the modified coatings. The diameter of the CNTs ranged between 10 to 15nm while the length ranged from 1 to 10μm. The nanotubes were provided in the form of agglomerated bundles with an average diameter of 400μm ranging from 50 to 900μm. The average size of the graphite phase laid in the range between 5μm (graphitic particles) to 50μm (chopped carbon fibers). The aforementioned carbon phases were employed individually and combined resulting to binary (CNTs-, GR-) and ternary coatings, respectively.
The dispersion method, duration and intensity was constant for all formulations, employing high speed shear mixing at 3000rpm for 3h.The dispersion parameters were selected on the basis of the maximum fracture toughness observed for the binary CNT composites in a previous study. Further details on the dispersion procedure can be found in [9]. After the dispersion, all epoxies were mixed with the respective quantity (100/30 by weight ratio), applied with a thin brush on anodised aluminum substrates, cured at 250C for 24h and post cured at 1000C for 4h. The thickness of all coatings was measured as 400±10μm by optical microscopy.
3. Methods
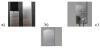
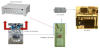
As received, anodised and coated substrates were then cut to rectangular specimens with dimensions of 20x100mm (Figure 1a). At the back side of each specimen a pico AE sensor and copper wires were attached and sealed with Teflon tape, for the electrochemical tests. The AE sensor was connected to a Mistras preamplifier, while AE Win software suite was recording the acoustic activity. The specimen was connected to an ACM Instruments Gill AC potentiostat/ galvanostat (through the copper wire) as a working electrode, with an Ag/ AgCl (3.5 M KCl, EAgCl = ESHE 200 mV) reference electrode and a platinum gauge counter electrode (Figure 2), in a typical 3-electrode electrochemical cell configuration. The front side was then covered with sealant tape leaving a surface area of approximately 1 cm2 to be exposed to aerated 3.5% NaCl solution, at room temperature (RT) (Figure 1 b-c).
The steady state potential (Erest) was recorded during immersion in 3.5% NaCl for 1h (open circuit). Then, polarization started at a scan rate of 10 mV/min. The susceptibility of the alloys to localized corrosion was investigated by reverse (cyclic) polarization. The main concept of this technique is that pitting would occur if the current density of the anodic portion of the return scan is higher than the current density of the forward scan for the same anodic potential [30]. This type of hysteresis is labelled as “negative hysteresis” (More details can be found in [31]).
AE was simultaneously employed in order to record all AE activity during the tests. One ‘pico’ type sensor connected to a Mistras Group preamplifier, was attached to the specimen using ultrasonic coupling gel. Pre-amplification and threshold values were set at 40db and 40db respectively. As-received, anodized, neat and modified epoxy coated aluminum specimens (3-5 specimens) were tested in the aforementioned order, aiming at exploring the AE feasibility as an aluminum corrosion monitoring tool.
4. Results and Discussion
4.1 Interpretation of the anodic polarization behavior of anodized aluminum
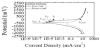
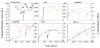
Figure 3 presents the cyclic polarization behavior of an anodized specimen. (Here it should be noted that cathodic polarization was also carried out in order to intensify the action of localized processes by introducing cathodic reactions on the specimen). As seen from the negative hysteresis loop (i.e. reverse currents greater than forward currents for the same potential), the aluminum alloy has been subjected to localized corrosion. This can also be seen by the sharp increase in the current density (i) by almost four orders of magnitude, at potentials higher than the breakdown potential (Eb).
In detail, the forward anodic polarization curve of anodized Al2024 is divided in four stages:
Stage 1a: (Ecp-Ecorr): Anodic oxidation of Al occurs at the structural defects of the anodization film, according to the generalized reaction [32]:
Stage 2a: Al 2024 exhibits passivation in the potential range Ecp (critical passivation potential) ÷ to Eb (breakdown potential) due to the phosphoric treatment. The active sites of stage 1 are covered by the long been known bi-layered structure of the passive film on aluminum: the inner layer is a compact amorphous layer whilst the outer layer is a permeable hydrated oxide layer [33].
Stage 3a (Epseud-Eb): Passivation ends at Eb, as shown by the flat gradient sustained for almost four orders of magnitude current density increase. The breakdown of passivity may be attributed to deficient sealing of the porous upper layer of the anodic film. Full sealing by immersion in boiling water following anodization in H3PO4, was not applied, since it would decrease the ability of the anodic film to anchor organic coatings [34]. As the anodization film is composed of an inner denser barrier layer and an outer looser porous layer, the chloride ions can access the barrier layer through the pores. When the chloride ion concentration at the bottom of the porous layer reaches a critical level, the barrier layer begins to dissolve. Completely or partially sealing the tubular pores would reduce both the chlorine ion speed and concentration at the bottom of the porous layer. As the anodic over potential increases, the chloride concentration on the barrier layer also increases. Hence, the greater the range of passive over potentials and the lower the passive current densities, the higher the corrosion resistance of the anodization film. Nevertheless, the fact that the pitting potential is ~400 mV nobler than the corrosion potential demonstrates a moderate efficiency of the anodizing process; as for non-surface treated Al 2024, the pitting potential and corrosion potential values almost coincide.
As soon as Cl- accesses the Al substrate having surpassed the obstructions of the anodization over layer, localized corrosion of Al takes place. Four steps are generally accepted to be involved in the localized corrosion of aluminum [35]:
- The adsorption of the reactive anions on localized sites of the surface film of aluminum (i.e. sites where the film presents in homogeneities [36]).
- The chemical reaction of the adsorbed anion with the aluminum ion in the aluminum oxide/hydroxide lattice.
- The thinning of the oxide film by dissolution. This dissolution is a flaw assisted/ flaw centered process. (The passive film on Al-alloys exhibits semi-conductive properties owing to the non-stoichiometry of composition and local structural in homogeneities [36]).
- The direct attack of the exposed metal by the anion possibly assisted by an anodic potential.
On the above grounds, stage 3 is interpreted as follows:
- Once aggressive anion adsorption on the aluminum oxide surface film at the defective site occurs, an active centeris developed. In the case of Al2024, the usual film defective site is the interface between Al and S-phase (Al2CuMg) [37]. The latter is less noble than Al. The active center was then the site for accelerated film thinning [35].
- Once the film is sufficiently thinned, direct attack of the exposed metallic substrate occurs. Because the film is thinned locally, the attack on the metal is also concentrated. Due to the electrochemical potential difference between Al and S-phase [38], localized dissolution of the anodic S-phase should occur. Nevertheless, the dissolution characteristics of the S phase are complex and have been shown to incorporate a dealloying mechanism, leading to localized Cu enrichment. It may be assumed that the S-phase does not dissolve as a unique entity, but may undergo a dealloying process leading to selective dissolution of the Mg and Al components of the intermetallic. The resultant Cu enrichment may allow for the intermetallic to behave as a local cathode after some unknown time that eventually leads to dissolution of adjacent Al. As a consequence, small pits are formed.
- As the pits are getting deeper, differential aeration cells are formed between the bottom of the pits and the pit walls.
Stage 4a (E>Epseudo): The hydrolysis of Al in microscopic and macroscopic heterogeneities according to reaction (1), results in reduction of pH and consequently further dissolution of Al. Diffusion of Cl- follows into the flaws to maintain electro-neutrality. The agile chlorine ions induce further hydrolysis reactions, which may lead to the formation of more Al(OH)3 [18] or Al(OH)2+ [39]. Thus, further decrease in the electrolyte pH in the flawed areas occurs, stimulating further and faster aluminum dissolution. With raising potential above Epseudo, the chlorine concentration in the flawed regions increases. As a consequence, the pH falls to such low values, that Al hydroxides/ oxyhydroxides become instable [40]. At E>Epseudo, the rate of formation of Al hydroxides/ oxyhydroxides is greater than the rate of their dissolution leading to pseudo passive stage 4.
Although these films are heavily hydrated and soluble, as shown by the very high current densities, they seem to temporarily protect the Al substrate due to their thickness, as the positive hysteresis loop upon reverse polarization through stage 4 shows. As reverse scanning passes below Epseudo, the instable films dissolve and pits reopen. Thereafter, hysteresis becomes negative. The potential of anodic to cathodic transition (Ea/c tr) is nobler than Ecorr, suggesting that any current limiting process upon anodic polarization is reduced or even absent at the corrosion potential [41]. The aforementioned potential values for the as-received, anodized and coated specimens are summarized in Table 1.
5. Polarization Behavior of Coated Aluminum Substrates
As can be seen in Figure 4, the application of the epoxy coatings significantly enhanced corrosion protection to the aluminum substrates, in terms of shift of the polarization curves to significantly lower current densities as compared to the polarization curves of the as-received and anodized substrates (more than 2 orders of magnitude lower in the case of the hybrid coating, more than 4 orders of magnitude lower in the case of the AGR coatings and more than 1 order of magnitude lower in the case of the CNT and neat epoxy coatings. In the case of the neat epoxy and especially graphite and hybrid coatings, the polarization curves have shapes analogous to those characterizing uniform corrosion; no sharp and persistent increases in the current density (i.e. flattened curve parts) are observed whilst hysteresis loops have nil to very small surface areas. The CNT doped epoxy coating demonstrates a different polarization behavior, as will be analyzed later.
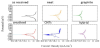
All the doped resin coatings demonstrate a conductive behavior (very low conductivity in the case of the graphite doped epoxy) attributed to the a) conductive nature of the carbon allotropic fillers and b) water uptake by the main volume of polymer and areas of deficiently cross-link density, as analytically described in previous works [3,7,8,42,43]. The conductive behavior of the neat epoxy coating is attributed to reason (b).
The observed differences on the curve shapes and the electrochemical values in relation to the curve of the anodized substrate in Figure 4, suggests that the electrolyte has not accessed the aluminum substrate. The modified resin coatings present nobler, as in the case of CNT coatings, or the same, as in the case of the AG coatings, anodic-tocathodic potential as compared to the corrosion potential. The current density values are significantly lower when compared to the un-coated specimens. The slightly higher current density values during the reverse polarization may be attributed to the aforementioned water uptake.
The stabilization of current at high anodic potentials may be ascribed to the saturation of the polymer with water [3,42,43] and formation of unstable polymer oxidation products [44]. The absence of reinforcement/matrix interfaces in the case of neat epoxy is the reason for a more massive water uptake during reverse polarization and, consequently, notably higher reverse currents than the respective forward ones through the whore reverse scan. In the case of the filled epoxy coatings (AGR and Hybrid), the existence of many interfaces result in limitation of the “bulk” water ingress in favor of the “interfacial” water ingress. Hence, the differences between the forward current density values and the reverse current density values are much more subtle than those in the polarization curves of the neat epoxy coating. However, in the case of the CNT-modified epoxy coating, the negative hysteresis loop (of considerable area below Epseudo) indicates permanent effects associated with the presence of the CNTs
In the case of the CNTs coatings, it is seen that the polarization curve is not as smooth as in the case of the AG or ternary ones, exhibiting a spiky morphology analogous to that of metastable pitting in metals. This behavior can be attributed to the ingress of water to the vast number of interfaces between CNT particles and epoxy matrix. The water could have penetrated the interfacial areas activating the surface thus increasing current density. In analogy with the metals, the “spiky” morphology of the polarization curve at its pseudo-stabilization stage could constitute evidence of an alternating interfacial saturation (instant current decrease)/swelling (instead current increase) process, which eventually leads to a permanent swelling, as the negative hysteresis below Epseudo suggests.
When observing the three modified coatings curves, it is evident that the hybrid coating curve presents an intermediate behavior when compared with the CNTs and AG coatings. This behavior could be an indication of synergistic effects between the fillers like the ones observed in [9]. Most important, the hybrid coating is the only one that, during the reverse cathodic polarization presents cathodic current values that are almost equal to those of the forward cathodic polarization, indicating an interactive effect of the different fillers that may eventually offset the negative effects of the water uptake.
6. Acoustic emission and polarization curves
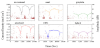
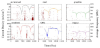
Figure 5, Figure 6 and Figure 7 present cumulative AE hits, signal amplitude and average frequency respectively and current density vs time curves respectively. In figure 5, the various corrosion stages have been marked onto the curve of the as-received Al2024 specimen for a clearer understanding.
The various corrosion stages during polarization are herein reported for a clearer correlation of the AE activity and corrosion process namely:
Stage 1c: cathodic forward polarization - hydrogen reduction:
Stage 2c: cathodic forward polarization -oxygen reduction:
Stage 1a: anodic forward polarization- oxidation of Al according to
reaction (1)
Stage 2a: anodic forward polarization-passivation at defects of
anodizing film
Stage 3a: anodic forward polarization-pitting at the interface between
Al and S-phase
Stage 4a: current stabilization by deposition of heavily hydrated
alumina films on pits (pseudo passivation) during anodic forward
polarization + anodic reverse polarization
Stage 5a: anodic reverse polarization-dissolution of films-pit
reopening
Stage 6c: cathodic reverse polarization-oxygen reduction (reaction 3)
Stage 7c: cathodic reverse polarization-hydrogen reduction (reaction
2)
The following observations are drawn from Figures 5, 6, 7 and 8 that illustrate the AE activity versus time during cyclic polarization. First of all, it can be seen that the open circuit step of the testing resulted in insignificant AE activity.
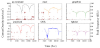
Regarding as received Al 2024, the cumulative hit vs. time data (Figure 5) can detect activity in stage 4a (final current stabilization) and 7c (H2 reduction during reverse cathodic polarization). The amplitude vs. time data (Figure 6) can detect activity in stage 1c, primarily (H2 reduction during forward cathodic polarization) and stage 2c, secondarily (O2 reduction), stage 4a (forward pseudo passivation portion) and stage 7c ((H2 reduction during reverse cathodic polarization). Similarly, the average frequency vs. time data (Figure 7) can detect activity in stage 1c, primarily (H2 reduction during forward cathodic polarization) and stage 2c, secondarily (O2 reduction), stage 4a (forward pseudo passivation portion) and stage 7c ((H2 reduction during reverse cathodic polarization). The peak frequency vs. time data (Figure 8) can detect activity also in stages 1c, 2c, stage 4a (forward pseudo passivation portion) and 7c. To summarize, the most intensive AE activity is associated with the hydrogen reduction stages that produce hydrogen bubbling upon cathodic polarization and the final pseudo passive stage (stage 4a-forward portion). The latter follows pitting and is characterized by heavily hydrated deposits on the pits. During pitting (stage 3a), hydrogen bubbles are also generated inside the pits due to dramatic drops of pH realized by the depletion of O2 inside the pits, the diffusion of Cl- into the pits and hydrolysis reactions further lowering of the pH [46]. Therefore, it can be postulated that the recorded signals in stage 4a associate with hydrogen bubbling during stage 3a, indirectly manifesting the occurrence of pitting.
Regarding the anodized Al2024, a much less AE activity, as compared to that of the as received Al2024, is observed. Cumulative AE hits are over than 1 order of magnitude less than the ones recorded for the as received substrate. Anodizing has limited the number of the cathodic sites (the intermetallic precipitate/Al interfaces are covered by a more compact and less defective Al2O3 film) and the defects in the Al2O3 surface layer. Therefore, hydrogen bubbling due to hydrogen reduction is less. Conversely to the as-received substrate case, AE activity during stage 4a is observed only in the reverse portion of stage 4a. The reason for such behavior is not yet understood. It could be related with the following findings: a) The final current stabilization (pseudo passivation) of the anodized specimen started at ~500 mV higher than that of the as-received specimen, meaning that the Clconcentration at the surface of the anodized specimen is higher than that at the surface of the as-received specimen; b) Breakdown started earlier for the anodized specimen but the stabilization stage 4a lasted longer. None-the-less, the similarity in the AE signal patterns for the as-received and anodized specimens suggest similar corrosion mechanisms in compatibility with the similarity of the polarization curves.
Similar patterns were also observed in the average frequency curves for the as received and anodized aluminum. Clusters in the frequency range between 1-250 kHz with some scattered hits at higher frequency values (1000 kHz) are present in both aluminum types for all corrosion stages. The latter ones could be classified as environmental or electrical noise however further study should be conducted. The only differentiation that is present, can be seen during stages 6c and 7c, where in the case of the anodized specimen the recorded signals in the range from 1 to 250 kHz are absent.
The above-mentioned observations regarding the observed patterns in AE indices, give strong evidence that specific corrosion phenomena can be correlated to combinations of indices of the AE activity. The discrimination of these characteristics depend on the nature of the various corrosion related phenomena on the aluminum substrates and further studies could give a stronger indication for such a correlation.
When observing the combined potentiodynamic and AE indices curves in Figures 5 to 7 it is clear that AE activity was significantly affected by the applied epoxy coatings. All epoxy coatings exhibited significantly less AE activity when compared with the as received aluminum with the AG coating been the one with the fewest AE hits. In contrast, the hybrid coating exhibited a far greater number of AE hits with the CNTs being in the middle. These phenomena can be attributed to the increased number of interfaces that were present in the hybrid coating. Another interesting phenomenon is the fact that in the neat epoxy coating, almost double the AE events were recorded when compared with the anodized specimen and the hybrid coating. It is also interesting that the majority of the recorded AE hits, were detected during the open circuit stage, whilst during the polarization measurement notably fewer AE events occurred. These phenomena could be associated with the initial ingress of water to the bulk of the polymer that can cause swelling of the epoxy, which in turncan lead to the generation of micro cracks in the surface. Later signals in the case of the neat epoxy coating, immediately after “Ecorr”, (Figure 6, Figure 7, Figure 8), may be explained by water adsorption at the areas of low/defective cross-link density. These are not observed in the cases of GR, CNT and Hybrid modified epoxy coatings, suggesting that the reinforcements have filled the defective areas of the epoxy. On the other hand, the reinforced epoxy coatings present a consistently increasing trend in the cumulative AE hits vs. time curves (Figure 5), evidence of interfacial water transport.
Both CNT coating and hybrid coating exhibited a similar trend in the recorded AE hits with a steadily increasing rate throughout the measurements. The observed “staircase step-like” behavior could be an indication that water was being absorbed at filler/matrix interfaces activating the surface with subsequent swelling and deactivation. Given that AG coating did not exhibit such a characteristic behavior (i.e. the increasing trend was smoother and of a lower rate), this pattern can be attributed to the CNT particles.
In terms of signals amplitude (Figure 6), apart from the neat coating, all recorded AE events, were scattered in the range between 40 db and 50 db with no specific pattern emerging. This behavior further enhances the aforementioned postulation of a limited water transport through the interfaces for the modified coatings. The small cluster in the range of 40 db- 50 db present in the neat coating roughly in the beginning of the anodic polarization, could be an indication of water ingress to areas of low-cross link density and subsequent formation of micro cracks in the coating surface, as aforementioned. The latter postulation could be further enhanced on closer observation of the average frequency curve of the neat coating (Figure 7). As can be seen, the cluster of signals lay in the range between 100-750 kHz, a range that in the case of the as received and anodized specimens, is present in the polarization measurement stages. This could be an indication of different phenomena between the three and an additional evidence of the AE capabilities as a corrosion monitoring tool.
More pronounced differences between the uncoated and coated specimens can be observed in Figure 8. It can be seen that the as received in the aforementioned stages exhibited signals in the frequency ranges from 1 kHz to 150kHz, 200 kHz and 500 kHz. As stated, these signals that were present for the anodized specimen also can be associated to the various corrosion phenomena and the by-products associated with them. In contrast, the coated specimen signals at low frequencies (up to 50 kHz) and high frequencies (500 kHz). The medium frequencies around 200 kHz are completely absent from the coating specimens. In combination with the aforementioned patterns of behavior for the other AE indices, it can be postulated that the observed signals can be associated with bulk water uptake and interfacial water transport and their associated degradation phenomena.
7. Conclusions
The following corrosion processes were identified by AE during cathodic and anodic polarization of anodized Al2024: a) hydrogen reduction during cathodic polarization, b) pseudo passivation by deposition of heavily hydrated alumina films on pits upon anodic polarization to high overpotentials. The likelihood of hydrogen evolution persistence during the final stage of current stabilization due to underlying pitting was raised. Based on the changes in the AE indices between the as received, anodized and coated substrates, hydrogen bubbles could be associated with low amplitude and medium peak frequency signals; pseudo passivation in terms of heavily hydrated films could be associated with low amplitude and high peak frequency signals; epoxy degradation phenomena like swelling and micro cracking could be associated with low amplitude and high peak frequency signals; reinforcement/epoxy interfacial water transport and likely degradation may be associated with a uniform and sporadic AE amplitude/average frequency signals. In general, the obtained experimental results, give a strong indication that AE can be an effective monitoring tool for aluminum corrosion studies. It has to be stated though that further investigation should be conducted so as to fully differentiate characteristic AE indices and correlate them with corrosion, epoxy and interfacial degradation phenomena.
Competing Interests
The authors declare that they have no competing interests.