


1. Introduction
Nickel electrodeposition is one of the most important coatings in electroplating industry, which is widely used for protective-decorative and functional materials owing to its excellent wear and corrosion resistance. With the development of modern high technology, nickel electrodeposition is applied in many fields such as information, electronics, aerospace, and defense [1] , especially in the aspect of micro/nanometer manufacturing techniques in recent years [2,3]. However, the performance of nickel coatings for applications is closely related to the process parameters, such as composition of electrolyte, operation temperature, pH value, cathodic current density, and the presence of additives. It has been demonstrated that additives under suitable concentrations play a vital role in the quality of metal deposits [4-6].
Nickel deposits can be obtained from various plating bath, such as chloride, sulphate, and sulfamate electrolytes. Among these electrolyte, It is found that relatively small amounts of additives have been used in plating bath to modify the properties of nickel deposits. For example, saccharin and 1,4-butynediol are frequently used to obtain the deposits with fine bright and levelling from a Watts-type electrolyte [7] . In this paper, the effect of saccharin as sole additive on the brightness, hardness, internal stress of nickel deposit, cathodic current efficiency, throwing power, and cathodic polarization behavior of plating bath from sulfate electrolyte is investigated in detail. In addition, the surface morphology and microstructure of nickel deposit are also discussed below.
One of the most economic and effective methods to overcome the above problem and to improve LIB performance is addition of electrolyte additives. The amount of an additive in the electrolyte is less than 5% either by weight or by volume; its effect on the cycleability and cycle life of LIB is significant. The electrolyte additives were discussed and summarized by researchers such as Zhang S.S. [7] . More specifically, diverse additives such as Li2CO3, vinylene carbonate (VC) have been reported as effective additives to improve the cycle life of LIB [10,11].
2. Experimental
Nickel electrodeposition is carried out at a constant current density of 4.0 A/dm2 by a direct current programmable power supply (ITECH IT6121, Nanjing China) to obtain an average thickness of 50 μm deposit with an area of 6 dm2. Distilled water is used for preparing the solution. The basic electrolyte is composed of 250 g/l NiSO4·6H2O, 30 g/l NiCl·6H2O, and 35 g/l H3BO3. All reagents are of analytical grade. The pH value of the electrolyte is adjusted to 4.2 by dilute H2SO4 and the temperature of electrolyte during electrodeposition is maintained at 50°C. Saccharin is added into the basic electrolyte with the concentrations ranging from 0.0 to 1.2 g/l.
A nickel sheet (99.9 % purity) with a dimension of 85 mm×55 mm×5 mm and a copper strip (the back side is insulated) with a dimension of 80 mm×10 mm×0.1 mm are used as an anode and a cathode, respectively. Prior to electrodeposition, the copper strip is mechanically polished with 1500 grade silicon carbide paper, then rinsed with distilled water and activated in 10 wt.% H2SO4 solution at room temperature for 30 s.
The microhardness of nickel deposits is measured at 1.96 N for 15 s by a digital microhardness meter (HXD-1000TMC, Shanghai China). The microhardness measurement is repeated for 5 times, and the microhardness value in here is the mean value of microhardness for 5 times. The internal stress of nickel deposits is determined by the copper cathodic curvature method [8] , and the internal stress is semiquantitatively analyzed by measuring the curvature of the plating part of copper strip. The tensile stress is denoted by a positive value curvature and the compressive stress is denoted by a negative value curvature.
The cathodic polarization behavior is performed in a glass cell with 150 cm3 of the electrolyte at 25°C using AUTOLAB electrochemical work station (ECO chemie, The Netherlands) at a sacn rate of 1 mV/s. A nickel disk (1 cm2), a Pt plate, and a SCE (saturated calomel reference) are used as the working electrode, auxiliary electrode, and reference electrode, respectively. Prior to test, the surface of working electrode is polished with 1500 grade silicon carbide paper and washed with distilled water. The cathodic current efficiency of the electrolyte is calculated by the copper coulometer method. The throwing power of the electrolyte is measured by the Hull cell method [9] . The throwing power measurement is carried out in a 320 cm3 trapezoidal cell with two copper strips (locate in different position) as cathodes and one nickel sheet as anode. The value of throwing power is between zero and 100 %.
The surface morphology of nickel deposit is examined by scanning electron microscopy (SEM, JSM-6380LV). The microstructure of nickel deposits are characterized by X-ray diffractometer (XRD, D/ max-IIB) with a Cu-Kα radiation (λ=1.542 Å) at a scan rate of 5°/ min for 2θ from 30° to 100°, while the voltage and the current are 40 kV and 40 mA, respectively. In order to quantify the crystallographic preferential orientation of nickel deposit, the relative texture coefficient RTC(hkl) is calculated, which is defined as [10]
where Ihkl and I0hkl are the diffraction intensity of the crystal plane (hkl) of nickeldeposit and a standard nickel powder sample, respectively, n is the number of diffraction faces in the diffraction pattern.
3. Results and Discussion
3.1 Effect of Saccharin on the Morphology and Microstructure of Nickel Deposit
Figure 1 presents the SEM images of nickel deposits obtained from sulfate electrolyte with different concentration of saccharin. It can be seen that when the concentration of saccharin is zero g/l, large pyramid-like crystallites are observed on the whole surface and the surface roughness is relatively large. When the concentration of saccharin is 0.1 g/l, the pyramid-like crystallites morphology change to colony-like morphology and the surface roughness is relatively small. Further increasing the concentration of saccharin from 0.3 to 1.2 g/l, the size of crystals get smaller and more compact deposits are obtained. It should be noted that too much saccharin (1.2g/l) results in large nodules on the surface of nickel deposits. This change of surface morphology of nickel deposits after adding saccharin can be ascribed to the inhibitory effect of the adsorbed species (saccharin) on the reduction of the nickel ion, which causes the overpotential shifts towards more negative value (as shown in Figure 7) and therefore promote the grain size refining [11,12].
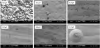
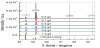
Figure 2 gives the XRD patterns of nickel deposits obtained from the electrolyte with different concentration of saccharin. It can be seen that the diffraction peaks of all nickel deposits are in good agreement with the standard card (JCPDS No. 04-0850, space group, fm3m) and can be indexed as face-centered cubic (fcc) nickel metal. When the concentration of saccharin is zero g/l, the diffraction peaks of (200) plane is much higher than all the other diffraction peaks. However, after adding saccharin in the electrolyte, the diffraction peaks from (200) plane of nickel deposit decreases greatly and the diffraction peaks from (111) plane increases. In particular, when the concentration of saccharin is more than 0.3 g/l, the variation of saccharin concentration shows minor effect on the intensities of the diffraction peaks of nickel deposits. The changes of diffraction peak intensities of nickel deposits suggest that the preferred orientation varied after adding saccharin in electrolyte.
In order to describe the structure and preferred orientation of the nickel deposits in detail, the texture coefficient (RTC(hkl)) is calculated and the results are shown in Figure 3. If the texture coefficient is greater than 100, it indicates the existence of a preferred orientation. When the concentration of saccharin is zero g/l, the RTC(hkl) value for the (200) orientation is greater than 100. Therefore, the preferred orientation of the nickel deposition is the (200) fiber texture. After adding saccharin in the electrolyte, the preferred orientation of the nickel deposition is still the (200) fiber texture, but the RTC(hkl) value for (200) orientation decreases greatly and the RTC(hkl) values for (111), (220), and (311) planes increases. When the concentration of saccharin is greater than 0.1 g/l, the RTC(hkl) values for all the planes are almost remain, indicating the further increasing the concentration of saccharin has almost no effect on the preferred orientation of nickel deposits.
3.2 Effect of Saccharin on the Hardness of Nickel Deposit
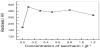
Figure 4 gives the change of microhardness of nickel deposits with the concentration of saccharin. With the concentration of saccharin increasing from 0.0 to 0.1 g/l, the hardness of nickel deposits increase sharply from 207 to 400 HV. Further increasing the concentration of saccharin from 0.1 to 0.8 g/l, the hardness of nickel deposits decreases slightly and then maintains to be about 350 HV. When the concentration of saccharin is increased to 1.2 g/l, the hardness of nickel deposits decreases to 322 HV. The changes of hardness of nickel deposit with the concentration of saccharin can be analyzed from variation of texture coefficient and the grain size of nickel deposits. The RTC(hkl) value for (200) orientation of nickel deposits obtained in the absence of saccharin is much larger than those with the presence of saccharin as shown in Figure 3. The (200) crystal orientation is known to be the “free mode of growth” for electrodeposited nickel [13] and therefore the deposition presents the maximum ductility and lower hardness among the other preferred crystal orientations. Generally, the hardness increases with decreasing grain size [14] . Therefore the large grain size of nickel deposit obtained the absence of saccharin (Figure 1) is also an important reason for the low hardness. However, below a certain low value of grain size, the hardness value would decreases with the decrease of grain size [15] . When concentration of saccharin is more than 0.1 g/l, the grain size of nickel deposits is further deceased to critical value and therefore the hardness of nickel deposits decrease slightly.
3.3 Effect of Saccharin on the Internal Stress of Nickel Deposit
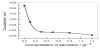
Figure 5 describes the relationship between the internal stress of nickel deposits and the concentration of saccharin. It can be seen from Figure 5 that the addition of saccharin can decrease the tensile stress of nickel deposits and result in the compressive stress eventually. In particular, when saccharin concentration increases from 0.0 to 0.3 g/l, the tensile stress is greatly declined. Further increasing saccharin concentration from 0.3 to 1.2 g/l leads to a slight increase in compressive stress of nickel deposits. The intense decrease in tensile stress of nickel deposit with saccharin concentration increasing from 0.0 to 0.3 g/l can be attributed to the co-deposition of sulfur and nitrogen from saccharin molecules [16] . As saccharin concentration is more than 0.3 g/l, the saccharin has reached saturated adsorption and therefore its effect on the internal stress of nickel deposition becomes very weak.
4. Effect of Saccharin on the Cathodic Current Efficiency and Throwing Power of Electrolyte
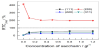
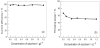
Figure 6a and 6b shows the changes of cathodic current efficiency and throwing power of electrolyte with the concentrations of saccharin. It can be seen Figure 6a that a minor change of 1~2% in current efficiency is observed with saccharin concentrations ranging from 0.0 to 1.2 g/l. For example, the highest current efficiency of electrolyte is 99.23% when saccharin concentration is 0.1 g/l, which is 1.23% higher than that (98%) without saccharin. Further increasing saccharin concentration from 0.1 to 1.2 g/l, the current efficiency of electrolyte maintains to an average value of 97.9 %. As seen from the Figure 6b, the throwing power of electrolyte decreases from 67% to 51% with the concentration of saccharin increasing from 0.0 to 0.3 g/l. Further increasing the concentration of saccharin from 0.3 to 1.2 g/l has almost no effect on the value of throwing power. Therefore, the concentration of saccharin has almost no effect on the cathodic current efficiency but slightly decreases the throwing power of sulfate electrolyte.
5. Effect of Saccharin on the Cathodic Polarization Behavior of Electrolyte
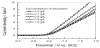
Figure 7 shows the relationship between the cathodic polarization curves of electrolyte and the concentration of saccharin ranging from 0.0 to 1.2 g/l. It can be seen that the cathodic overpotential is enhanced with the increase of saccharin concentration. This shift of the reduction potential towards more negative values can be attributed to the adsorption of saccharin molecule on the cathodic surface, which inhibits the reduction of nickel ions on the surface of cathode [17] .
6. Conclusion
The following conclusions can be summarized from the paper.
- SEM images indicate that the grain size of nickel deposits can be greatly decreased after addition 0.3 g/l saccharin in the sulfate electrolyte. Further increasing the concentration of saccharin from 0.3 to 1.2 g/l, the surface morphology almost remains. Too much saccharin (1.2 g/l) can result in large nodules on the surface of nickel deposits.
- The nickel deposits obtained from sulfate electroltye can be indexed as face-centered cubic nickel metal. In the absence of saccharin, the RTC(hkl) value for the (200) orientation is the preferred orientation. After adding saccharin in the electrolyte, the preferred orientation of the nickel deposition is still the (200) fiber texture, but the RTC(hkl) value for (200) orientation decreases greatly and the RTC(hkl) values for (111), (220), and (311) planes increases.
- As the concentration of saccharin increases from 0.0 to 0.1 g/l, the hardness of nickel deposit increases sharply. Further increase saccharin concentration from 0.1 to 1.2 g/l, the hardness of nickel deposit is declined slightly. This change of hardness can be correlated to the decreases of RTC(hkl) value for the (200) orientation and grain size of nickel deposits.
- With concentration of saccharin increasing from 0.0 to 1.2 g/l, the cathodic current efficiency almost remains but the throwing power of electrolyte decreases from 67% to 51% and the cathodic overpotential shifts towards more negative values.
Competing Interests
The authors declare that they have no competing interests.
Author Contributions
All the authors substantially contributed to the study conception and design as well as the acquisition and interpretation of the data and drafting the manuscript.