


1. Background
Both natural and anthropogenic drivers cause changes in the Earth’s climate. Crowley [1] states that prior to the Industrial Revolution (pre -1850) 41 to 64% of decadal scale temperature variations were due to changes in solar radiation and volcanism.
Budyko [2] studied “The Effect of Solar Radiation Variations on the Climate of the Earth.” He concludes that secular variations of the mean temperature of the Earth can be explained by variations in short-wave radiation arriving at the surface. He found that comparatively small variations in atmospheric transparency could be sufficient for the development of quaternary glaciations.
Robock [3] wrote an extensive review article on “Volcanic Eruptions and Climate.” In a few days after an eruption, the amplitude of the diurnal cycle of surface air temperature is reduced under the cloud. On a much larger time scale, volcanic effects played a major role in climate change during the Little Ice Age.
After 1850, anthropogenic drivers of the climate (namely, CO2, CH4 and N2O) became steadily more important than natural climate drivers. Crowley’s model indicates that only about 25% of the 20thcentury temperature increase can be attributed to natural variability.
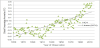
Working Group 1 [4]: The Physical Science Basis - of the IPCC Fifth Assessment Report states that the warming of the climate system is unprecedented since the 1950s. The linear trend line through the HadCRUT4 data in figure 1 indicates a temperature increase of 0.8°C from 1850 through 2014. The largest contribution to total radiation forcing at the surface during the 20th Century is caused by increased atmospheric concentrations of CO2.
In general, climate scientists look at global warming as a time series of increasing temperature anomalies along with a separate time series of increasing CO2. Can changes in CO2 alone explain temperature anomalies, both of which are treated as singular functions in time? This process seems to be a fault in their analysis procedures.
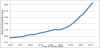
To illustrate this point, figure 2 is a time series of CO2 increases since (1850 – 2014) and Figure 1 shows the global temperature anomalies of the Earth for the same period. Both graphs are singular functions in time. It is evident from the graphs that CO2 increases seem to mirror the variations in temperature. However, if the scale of Figure 2 was changed, a good comparison would be lacking. Certainly both graphs indicate increasing magnitudes in time, and since CO2 is a GHG, there is a physical coupling. The logic appears to be sound.
2. Cross Correlation Formulation
Cross correlation is a standard method of estimating the degree to which two series are correlated. Consider two series X(i) and Y(i) where I = 0, 1, 2… N-1. The cross correlation coefficient ρ is defined as
mX and mY are means of their corresponding series and σX and σY are their respective standard deviations. The denominator in Eq. (1) serves to normalize the correlation coefficients such that (-1 <= ρ(X,Y)<= +1), the bounds indicating maximum correlation and 0 indicating no correlation. Also Eq. (1) assumes the time delay is zero. The term R2 is defined herein as the square of the correlation coefficient (ρ2) and is a measure of how much the variance of Y(i) is explained by the variance of X(i).
Calculations utilized the CORREL function of MS Excel spread sheets. The CORREL function is identical to Equation (1).
3. Correlation of Temperature Anomalies with Increases of CO2 Concentration
How much does an increases in CO2 concentrations explain the record of global temperature warming? To determine this, data in Figure 1 are cross correlated with the HadCRUT4 data of figure 2 over the same period (1850 to 2014)
Calculations for global data indicate a correlation of ρ = 0.691 and R2 = 48%., for the Northern Hemisphere ρ = 0.683 and R2 = 47% and for the Southern Hemisphere, ρ = 0.662 and R2 = 44%.
R2 values indicate that less than 50% of the variance of global temperatures is explained by the variance of CO2 concentrations. These results are important in understanding the contribution of CO2 to the global warming picture.
4. Concluding Remarks
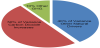
Both anthropogenic and natural drivers of the Earth’s climate affect the temperature anomalies of the HadCRUT4 data set. Thus, the total variance (100%) may be explained by these two factors. In round numbers, 50% of the variance is explained by CO2 increases, and perhaps an additional 10% may be due to other greenhouse gases. The 40% of the variance that remains may be attributed to natural climate drivers such as volcanic activity, solar variations, El Nino cycles, coming out of the Little Ice Age, pollution particulates, etc. The 40% value is in keeping with Crowley’s estimate of 25% for the 20th century.
This partitioning of variances is illustrated in figure 3.
There is a lack of robust correlation between the increase in CO2 emissions and global temperature rise. If global warming is caused primarily by manmade increases in CO2, why is there not a 0.90 correlation? In conclusion, evidence of warming is not evidence of what causes the warming.
Competing Interests
The author declare that there is no competing interests regarding the publication of this article.
Acknowledgments
Thanks go to my daughter Mary Elizabeth who helped greatly in editing this manuscript.
Abbreviations
GISS: Goddard Institute for Space Studies
MS: Microsoft Corporation
NASA: National Aeronautics and Space Administration
UK: United Kingdom
US: United States