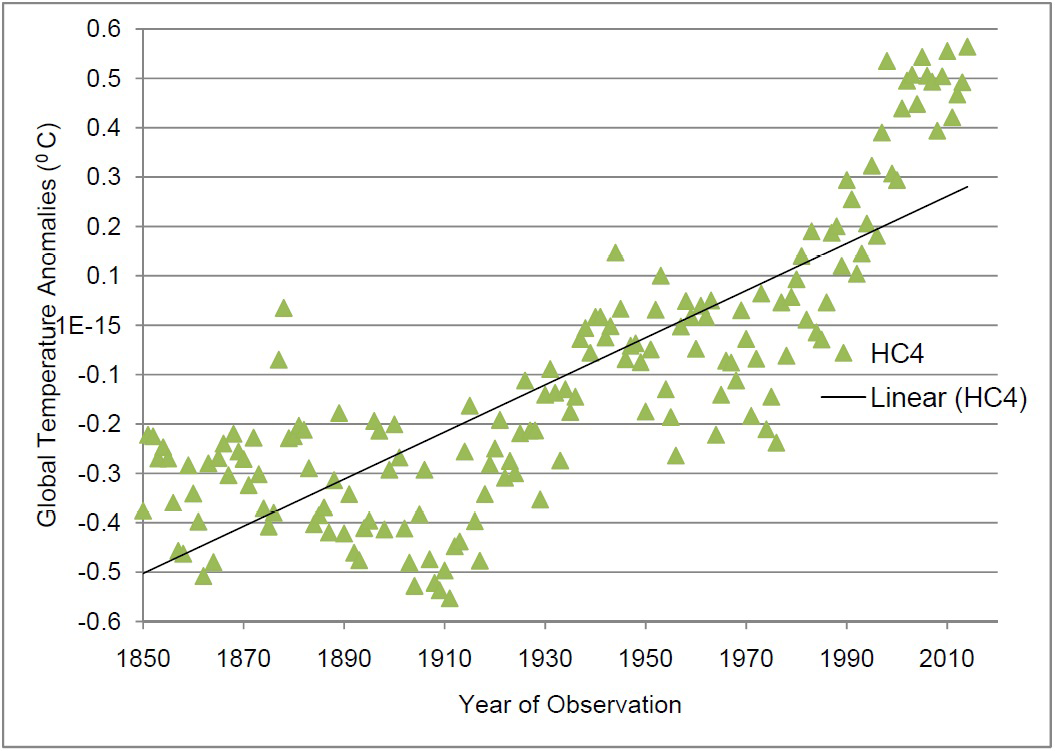
Figure 1:
Plot of Temperature Anomalies from the HadCRUT4 Data Set - (UK) - URL(1).