


1. Introduction
Recently, surface ozone is becoming a rising threat to human health and crops and a major concern all around the world [1-7]. The formed surface ozone from pollution sources, which remains suspended for several hours and can travel long distances, endangers local and regional receptors, and exposes human health to recognized adverse effects [8-14]. Nawahda et al., [1] estimated that elevated ozone concentration in 2000 and 2005 caused around 7,050 and 8,612 premature mortality cases respectively. Additionally, Japanese epidemiological studies have shown associations between air pollutants and asthma prevalence [15-18]. Yamazaki et al., [19,20] found that the odds ratio (OR) in warmer months per 10 ppb increment in 24–hr mean concentration of surface ozone was 1.25 (95% Confidence Interval (CI): 0.87–1.82), and the association between ozone concentrations and asthma admissions for the preschool age group (2–5 years) was stronger than the age group of 6–14 years. Also rice crop, which is the main crop in Japan, is likely to be affected by surface ozone as it can be estimated easily based on AOT40 index (accumulated exposure over a threshold of 40 ppb calculated for three months during the growing season) [7].
The concentration of surface ozone has been increasing in East Asia because of the repaid development and exploding urbanization, these are causing an extensive emitting of ozone precursors; nitric oxide and nitrogen dioxide (NOx), volatile organic compounds (VOCs), and methane. In Japan monitoring of surface ozone in the from of photochemical oxidant (Ox) started in 1976. In 2009, the number of Ox monitoring stations in Japan was; 1,183 stations (fixed: 1,152 stations, mobile: 31 stations). The air quality standard of Ox concentration in Japan is; 0.06 ppm 1-hour means value. According to annual report of the Ministry of the Environment in Japan (MOEJ) for the year 2009 [21], this standard was only met in one fixed station out of the 1,152 stations. Additionally, during the period from 2005 to 2009 Ox concentrations, greater than 0.06 and less than 0.12 ppm, were recorded in 631 stations and concentrations greater than 0.12 ppm recorded in 517 fixed stations. Similarly, for mobile stations the numbers of stations were; 24 and 5 stations, respectively. During the past 34 years (1976-2009), MOEJ reported the annual mean of the maximum hour concentrations of Ox during the daytime period.
These reports showed gradual increase in concentrations above 0.04 ppm starting from 1993 to the year 2009 in fixed stations and greater than 0.033 ppm in mobile stations. This happened even though the concentrations of non-methanic hydrocarbons (NMHC) and NOx, precursors for Ox, are yearly decreasing. During the past 34 years, NMHC concentrations (3 hr concentrations from 6:00−9:00 AM) decreased from 0.45 to 0.17 ppm C in fixed stations (321 stations), and in mobile stations (174 stations) concentrations decreased from 0.93 to 0.22 ppm C. Also, during the period from 1970-2009, the mean annual concentrations of NO2 and NO in fixed stations (1,351 stations) decreased from 0.044-0.012 ppm and from 0.041- 0.005 ppm, respectively. Similarly, in mobile stations (423 stations) the concentrations of NO2 and NO decreased from 0.055-0.023 ppm and 0.104-0.021 ppm, respectively. This indicates an elevated transboundary Ox originating from upwind regions, and has already encouraged many researchers to develop Chemical Transport Model (CTM) coupled with emission inventories for simulating the spatial distribution and temporal variation of surface ozone in East Asia. However, there are challenges in these simulations since the variation of surface ozone concentration is not the same in urban and remote sites. In urban sites it depends mainly on the emissions of the primary pollutants such as NO and NO2 due to burning of fossil fuel in mobile and stationary sources in large cities. Meanwhile in remote sites it is related mainly to chemical transport. Additionally, high uncertainty in the emission inventories in East Asia and limited validations of the simulated concentrations.
This study aimed to investigate the association between the annual increase of the industrial waste gas emissions in China from 2000 to 2009 and the annual increase of surface ozone concentrations during the same period. Additionally, it shows satellite images and simulations of the meteorological parameters such as wind speed and direction in East Asia by the Weather Research and Forecasting Model (WRF). The findings of this study are proposed to be a step toward a better understanding of the reasons behind the annual increase of surface ozone concentrations in Japan.
2. Material and Methods
2.1 Surface ozone data
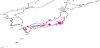
Our analyses are strongly related to the reliability and high quality of the monitoring concentrations of surface ozone in Japan. Accordingly, 1–hr daytime and maximum–hr concentrations of surface ozone were obtained from 1,183 monitors distributed in 47 prefectures for a 10- year period (2000 – 2009). These concentrations were obtained from the National Institute of Environmental Studies [22]. These stations are managed and operated by MOEJ and local governments in Japan. At these monitoring stations, surface ozone is observed by absorption spectrophotometer using a neutral potassium iodide solution (KI method) or by photometric instruments based on absorption of ultraviolet region (UV method), both methods are calibrated and compared with the Standard Reference Photometer (SRP) #35 built by the US National Institute of Standard and Technology (NIST). The relationship between the two methods was identified. The selected ozone monitors are shown in Figure 1. Table 1 shows only the stations located in the area along the Sea of Japan.
2.2 Emissions from China
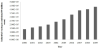
The industrial waste gas emissions in China from 2000 to 2009, as shown in Figure 2, were obtained from China Statistical Yearbook on Enviroinment-2010, which is compiled by the National Bureau of Statistics and the Ministry of Environmental Protection in China. The emissions of NOx from mobile sources in China are yearly increasing because of the rapid increase of vehicles; however, there is insufficient official and reliable information about these emissions in all places in China. Tang et al., [23] studied the trend of surface ozone from 2000 to 2006, they found similar trends to those illustrated in Figure 2. The association between the annual increase of industrial waste gas emissions in China from 2000 to 2009 and annual mean concentrations of surface ozone (1–hr daytime and maximum–hr values) was compared using the Pearson correlation coefficient (r) for the study period from 2000 to 2009. The annual mean concentration of surface ozone in each prefecture located along the Sea of Japan was estimated by calculating the average of the annual mean concentrations of surface ozone from each station within its boundaries. The correlation coefficient was calculated based on both 1–hr daytime and maximum–hr mean concentrations.
2.3 Meteorological simulations by WRF
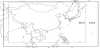
In the present study, we have used the Weather Research and Forecasting (WRF) model version 3.1.1 for the simulations of the meteorological parameters observed over East Asia from 12 to 15 April 2006, which is the ozone season in the region. We have used the model with Advanced Research WRF (ARW) dynamical core and for model simulations we considered a configuration with two nested domains of 27 km and 9 km grid spacing. The configurations used for model simulations are shown in Figure 3. The model used 35 vertical levels with the top of model at 2 hPa, and was initialized with the Global Forecast System (GFS) initial conditions of 1.0 degree resolution of 00:00 UTC from 5 to 17 April 2006. Also, it was integrated up to 72 h with every 6 h updates of the boundary conditions taken from the GFS analysis.
3. Results
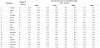
Figure 4 shows Box graphs of the annual mean concentrations of surface ozone (1–hr daytime mean values, and maximum–hr mean values) in prefectures located west of Japan along the Sea of Japan. Significant positive correlation coefficient was observed between these concentrations and annual increase of industrial waste gas emissions in China from 2000 to 2009 as shown in Table 2 and Figure 5. The correlation coefficient (r) values for most of these prefectures were high expect in four districts (Yamagata, Toyama, Shimane, Okinawa) where negative values were obtained.
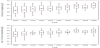
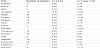
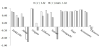
Figure 6 shows samples of the streamline plan view derived by Unidata-IDV software from the x-direction and y-direction of the WRF simulations of both wind velocities at 10 m above the ground surface (U10 and V10) from 00:00 UTC of 12 April to 22:00 UTC of 15 April 2006.

4. Discussion
In this study, we focused on the annual variations of surface ozone concentration and annual industrial waste gas emissions in China from 2000 to 2009. This is due to lack of official information about seasonally and monthly variations of these emissions. We found different association between the annual mean concentration of surface ozone, 1–hr daytime and maximum–hr mean values, and the annual industrial waste gas emissions in China from 2000 to 2009. The positive values of the correlation coefficient in Table 2, are consistent with satellite images by NOAA as shown in Figure 7. However, significant inverse associations were also found in four prefectures, (Figure 5), due to topography in case of Yamagata, Shimane, and Toyama, where these prefectures are surrounded by high mountain series. For Okinawa, it has few monitors and it is far from the path of the emissions as shown by the streamline views in Figure 6.
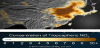
The streamline plan views in Figure 6, show clearly that during ozone key season emissions from sources located in the northern parts of China are directly transported to western parts of Japan along the Seas of Japan, this is also consistent with the transport of yellow sands from northern parts in China to western parts of Japan. However, they also show clearly that transport of emissions from Japan could also happen. The simulated streamline plane was not validated by comparing monitored data with the WRF- simulated levels due to the following reasons: 1) Comparing ground level point data measurements with the model “Box” averaged values involves high uncertainty considering the size of the “Box”, time resolution, and number of monitors within the domain. 2) WRF-simulations were initialized by real and preprocessed data. 3) Validation of the simulations was out of the scope of this study. 4) The period from April 12 to 15 was just randomly selected since the aim was to illustrate streamline simulations and not to conduct air quality modeling in the lower atmosphere where wind speed and direction change with height and ozone concentration increases with height as well.
The uncertainty level in the findings of this study is believed to be insignificant because of the large number of the distributed ozone monitors in Japan. The uncertainty caused by using 1–hr daytime and maximum–hr mean concentrations instead of hourly data (24–hr data) in the analyses could affect the findings in this study, but insignificantly. To confirm this assumption we calculate the Pearson correlation coefficient between the three values for the year 2009, the (r) value for correlating 24–hr concentrations with 1–hr daytime concentrations was 0.93, and the (r) value for correlating 1–hr concentration with maximum–hr concentration was 0.6. The uncertainty caused by local emissions of ozone precursors and other primary air pollutants also is insignificant because the annual reports of the MOEJ showed clearly that air pollutants such as; NOx, SOx, aerosols, and NMHC (Non–Methanic Hydrocarbons), are yearly decreasing since the past 30 years. Accordingly, the high (r) values in Table 2, suggest clearly that the long-term association is strong between the annual increase in industrial waste gas emissions from China and the annual increase in surface ozone concentrations in Japan and it is sufficient to assume a plausible significant association.
5. Conclusion
The present study adds clear evidence that there is significant association between the annual increase in industrial waste gas emissions from China and the annual increase in surface ozone concentrations in Japan during the period from 2000 to 2009. We found that the annual mean of the 1–hr daytime and maximum–hr concentrations of surface ozone are positively associated with the annual increase of the industrial waste gas emissions in China from 2000 to 2009. This finding suggests that emissions from China could be the reason behind the annual increase of surface ozone concentrations in Japan. However, limited spatiotemporal information about surface ozone and its precursors in China makes it hard to quantify the contribution percentage. A comprehensive emission inventory for China is needed in order to be coupled with CTMs, and then more accurate quantification of the transboundary surface ozone could be evaluated.
Acknowledgments
I would like to thank Allah for the great support. Also thanks to Asia Center of Air Pollution Research (ACAP), Niigata, and the Ministry of the Environment, Japan, (MOEJ) for providing useful information about ozone monitoring.