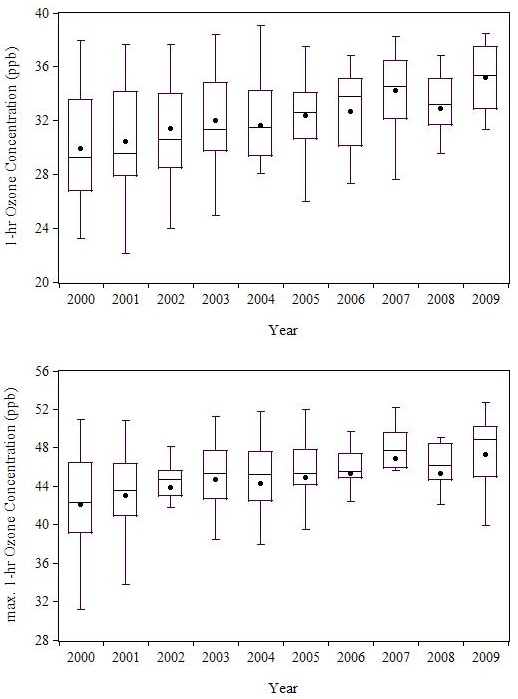
Figure 4:
Box diagrams for the annual variations of the monitored ozone concentrations in Japan from 2000 to 2009.