


1. Introduction
Impaired insulin sensitivity (SI), and deteriorated insulin secretion (ISEC) are the two major pathophysiologies of type 2 diabetes (T2DM) [1]. In the early course of diabetes, β-cells try to compensate the higher insulin resistance (IR) as much as possible to maintain glucose balance. During this period, the plasma glucose level is kept within normal range. However, when the decompensation of the ISEC eventually occurs, the clinically evident diabetes could then be observed and diagnosed. [2]. Moreover, compared to SI, impairment of β-cell function is considered to be the major determinant in the development of T2DM, especially in Asians [3-4].
There are two phases of insulin secretion- the first phase (1st ISEC) and the second phase (2nd ISEC). The 1st ISEC is normally secreted by β-cells within 10 minutes after they are exposed to a rapid elevation of plasma glucose levels. After that, 2nd ISEC rises gradually and reaches a steady state within 2-3 hours [5]. Earlier studies had showed that the 1st ISEC is invariably impaired even in prediabetes and will further lost in overt T2DM [3,6-7]. However, on the contrary, 2nd ISEC is preserved after T2DM occurs. The glucose homeostasis in T2DM majorly depends on this 2nd ISEC [8]. Theoretically, it should be related to the length of duration that oral antidiabetic drugs could affectively control blood glucose levels. Once the 2nd ISEC also fails, only injection of insulin will be the only treatment modality to maintain good glucose control. In this sense, with very little 1st ISEC, 2nd ISEC represents actually insulin storage in overt T2DM [9]. These aforementioned findings unanimously that 2nd ISEC plays a more important role than the 1st ISEC to maintain glucose metabolism. However, most studies, when discussing ‘insulin secretion’, only meant either 1st ISEC or homeostasis model assessment of β-cell function (HOMA-β). HOMA-β only presents the static insulin secretion in the fasting status. It is neither 1st nor 2nd ISEC. Even though important, till now, it is not only difficult to measure 2nd ISEC but also its importance has very little been discussed [10-12].
Metabolic syndrome (MetS), the clustering of glucose intolerance, hypertension, obesity and dyslipdemia, has been established to be associated with higher risk of cardiovascular disease and diabetes [13]. In the same time, each MetS components has also been known to be associated with the β-cell function [14-16]. As aforementioned, 2nd ISEC plays an important role in glucose metabolism and its importance is often overlooked, it is important to build an equation to estimate 2nd ISEC.
In this study, we used the modified low dose graded glucose infusion test (M-LDGGI) to measure 2nd ISEC in subjects with varying degree of glucose tolerance [7-8]. Then, equations were built to predict 2nd ISEC with demographic variables, MetS components and fasting plasma insulin (FPI) level. Hopefully, these equations could be used in clinical practice settings, in the same time, help us to understand more about the importance of 2nd ISEC.
2. Materials and Methods
2.1 Subjects
We enrolled 82 subjects, including 15 with normal glucose tolerance (NGT), 26 with pre-diabetes (PreDM) and 41withT2DM, between 40- 70 years old in our out-patient clinic. Other than diabetes, they did not have significant medical diseases, history of diabetic ketoacidosis, nor had any changes of dose of oral hypoglycemic medications during the study period. The diagnostic criteria for diabetes were based on the 2012 American Diabetes Association criteria [17]. Before participating in the study, they were instructed by physicians and dietitians not to receive any medication known to affect glucose or lipid metabolism and to remain on a stable diet for at least 1 wk before the study. On the day of the first study, an entire routine workout was completed by participants to exclude those with significant cardiovascular, endocrine, renal, hepatic, and respiratory disorders. The study protocol had been approved by the hospital’s Institutional Review Board and Ethics Committee; all participants were provided written informed consent prior to participating. To validate our equation, 75% of the participants were randomly selected. Based on these participants, an optimal equation was built for estimating the 2nd ISEC. This equation was subsequently used to calculate the 2nd ISEC among the remaining 25%, who constituted the external validation group.
Modified low-dose graded glucose infusion (M-LDGGI): This test was originally proposed by Polonsky et al. Since it is time consuming and complicated, we have modified the original test to a shorter version. From our unpublished data, the 2nd ISEC derived from original low-dose graded glucose infusion test is high correlated with that from M-LDGGI (r = 0.786, p = 0.000, data is not shown). We have published the use of the M-LDDGI previously [8]. The tests were performed at 0800 with subjects in the sitting position after a 10-h overnight fast. An intravenous catheter was placed in each forearm, one for blood sampling and one for glucose infusion. The sampling catheters were kept patent by slow infusion of 0.9% saline. The catheters were placed as what we mentioned in the previous paragraph, a stepped intravenous infusion of glucose (20% dextrose) was then started at a rate of 2 mg/kg/min, followed by 6 mg/kg/min. Each infusion rate was maintained for 80 min and blood samples were drawn at a 20 min interval for the measurement of plasma insulin and glucose levels. The results were interpreted as the slope of the changes of plasma insulin levels (y-axis) against the plasma glucose levels (x-axis). It should be noted that the component of time is not considered in this figure. Basically, it shows the response of insulin secretion in response to certain amount of plasma glucose level. Thus, the slope of these curves were regarded as the 2nd ISEC.
The calculations of homeostasis model assessment of insulin resistance (HOMA-IR) and HOMA-β were calculated according to Matthew’s equations [18].
The blood samples were centrifuged immediately and stored at –30°C until time of analysis. Plasma insulin was measured by a commercial solid phase radioimmunoassay kit (Coat-A-Count insulin kit, Diagnostic products Corporation, Los Angles, CA, USA). Intra- and –inter-assay coefficients of variance for insulin were 3.3 and 2.5%, respectively. Plasma glucose was measured by a glucose oxidase method (YSI 203 glucose analyzer, Scientific Division, Yellow Spring Instrument Company Inc., Yellow spring, OH, USA). Serum total cholesterol (TC), triglyceride (TG), and high-density lipoprotein cholesterol (HDL-C) were measured by the dry, multilayer analytical Slide method in the Fuju DR-Chem 3000 analyzer (Fuji Photo Film Corporation Minato-Ku Tokyo, Japan).
2.2 Statistical analysis
Data was shown as mean β standard deviation. The independent t-test was used to compare the difference of demographic data and MetS components between the study and external validation groups. One-way ANOVA test was used to evaluate the demographic data, clinical characteristics and parameters derived from these tests among the NGT, PreDM and T2DM groups. The Bonferroni test was used for post hoc examination. Because FPI, 2nd ISEC, HOMA-IR, and HOMA-β showed right skew, log transformation was also performed for analysis.
In order to build the equation to estimate 2nd ISEC, we used the stepwise method in multiple regress analysis. We took sex, age, and MetS components as independent variables and 2nd ISEC as dependent variable. Due to the tight correlation between 2nd ISEC and FPI, another equation with the FPI as the independent variable was also built.
These equations were then used to calculate the 2nd ISEC in the remaining 25% participants. The correlation between the calculated- 2nd ISEC and measured 2nd ISEC were evaluated with Pearson’s correlation. Higher square of correlation coefficients (r2) indicates better prediction accuracy. Hierarchical multiple regression method was also used to examine predicting power between these equations.
All statistical analyses were performed by using the SPSS software system, version 13.0 (SPSS Inc., Chicago, IL, USA). A P values less than 0.05 were considered to be statistically significant.
3. Results
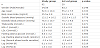
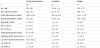
In the study, 62 and 20 subjects were classified into the study group and external validation group, respectively. Table 1 depicts the demographic data, FPG, FPI, plasma lipids and variables derived from the FSIGT of the 2 groups. There was no significant difference between and T2DM are shown in Table 2. Subjects in the T2DM group had higher FPG than the NGT group which is not surprising. In the same time, log (2nd ISEC), log (DI), log (GE) and Log (HOMA-β) were significantly lower in the T2DM group.
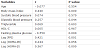
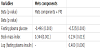
In order to understand which parameters contribute most to the 2nd ISEC, the correlations between different parameters and 2nd ISEC were determined and the results are shown in Table 3. It could be noted that 2nd ISEC was significantly correlated to BMI (r = 0.440, p = 0.000), FPG (r = -0.550, p = 0.000), DBP (r = 0.257, p = 0.044) and log (FPI) (r = 0.421, p = 0.001).
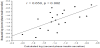
In the initial multiple linear regression analysis, only MetS components were used. Three factors were selected from the multiple regression analysis and the equation was built and shown below: log (2nd ISEC) = -2.400- 0.088 • FPG + 0.072 • BMI (standard coefficients were shown in Table 4). Then, by using this equation, the 2nd ISEC was calculated for subjects in the external validation group. The correlation between calculated 2nd ISEC and measured 2nd ISEC in this group was assessed and the results are shown in Figure 1.
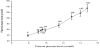
A significant correlation between calculated log (2nd ISEC) and measured log (2nd ISEC) could be noted (r = 0.650, p = 0.000, Figure 2).
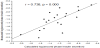
As mentioned earlier in the method, although not being a member of the MetS components, FPI was also added into the multiple linear regression model. Different from the first equation, three factors were selected and the equation was built as the following: log (2nd ISEC) = -2.316- 0.093 • FPG + 0.049 • BMI+ 0.434 • log(FPI). Similar to the first equation, the correlation between calculated 2nd ISEC and measured 2nd ISEC in external validation group was performed and r value is increased to r = 0.738 (p = 0.000, Figure 3).
The difference of predicting power of 2nd ISEC between first and the second equation was determined using hierarchical multiple regression method. The r2 increased significantly in both of the study (increased from 0.334 to 0.423, p = .000) and external validation groups (increased from 0.384 to 0.559, p = 0.023) after adding log (FPI) into FPG, and BMI.
Compared to the HOMA-β, it could be noted that both equations showed a better predictive accuracy for 2nd ISEC than HOMA-β (r = 0.587, p = 0.000). The standardized coefficient between associated factors and 2nd ISEC were shown in Table 4.
4. Discussion
In this study, we planned to build equation using the routine clinical measurements and MetS components to predict 2nd ISEC in subjects with different glucose tolerance. In the same time, FPI was also added into analysis to build the second equation to improve prediction power. External validation was also done to evaluate our results. Even though very few, there were still studies done to predict 2nd ISEC. However, most of them only enrolled non-diabetic subjects [6,19]. We believed that our equations provided in this study are easily to be used and important for clinical settings. Generally, the most widely used methods to measure 2nd ISEC are hyperglycemic clamp and LDGGI [20-21]. Using the hyperglycemia clamp technique, Chiu et al. found that ethnicity, gender, BMI, waisthip ratio and DBP would explain 36.2% of the variance to predict 2nd ISEC in NGT subjects [19]. Also using the same method, van Haeften et al. reported that the age, BMI and family history (FH) of T2DM could contribute to 2nd ISEC in NGT and PreDM subjects with 18.5 % variance (r = 0.43, r2 = 0.185 ) [6]. In our study, by using the MetS components, the r was as high as 0.650 in the external validation group, which is much better than the other two studies. After adding the FPI into the model, the r could even been improved to 0.738. Among the MetS components, only FPG, BMI and DBP were found to be associated with 2nd ISEC. Since the major purpose of β cell function is to maintain glucose balance, it is not surprising that FPG explains the greatest variance of the regression analysis in our study [15]. Other than this, earlier study has also demonstrated that 2nd ISEC decreased as FPG levels increase even in the non-diabetic range [22]. All these findings imply that 2nd ISEC is tightly related to glucose metabolism [8]. In other words, the gradual increase of the FPG indicates the impairment of β cell function, particularly 2nd ISEC. Right after the FPG, BMI was the second component which was selected into the regression model. This could be explained by the fact that adiposity is tightly related to ISEC which was supported by many studies. For instance, evidences have shown that obese subjects have higher ISEC [23-24]. In the same time, our earlier study also demonstrated the obese young subjects with T2DM had better 1st ISEC than lean ones [24]. Thirdly, Kloppel et al. had suggested that non-diabetic obese subjects had a higher β-cell mass and, thus, led to higher ISEC [25]. To be more specific, data of van Haeften et al. found that 16.8% variance of 2nd ISEC could be explained by BMI in NGT and PreDM subjects. Compatible with the observation of van Haeften et al, our study also demonstrated BMI explained a similar variance for 2nd ISEC in the study group (r2 = 0.116, data was not shown). The positive correlation between β-cell function and FPI level has been well-documented. Generally, the higher FPI level is, the better both phases of ISEC are [11-12,15,18,26]. Therefore, after adding FPI into regression analysis, r increased from 0.650 to 0.738 in the external validation group. Moreover, our study showed that FPI was a greater contributor to 2nd ISEC than BMI (Table 4). The results of Hanley et al. and Gower et al. have also shown the similar findings that FPI had higher correlation than obesity with β-cell function in non-diabetic subjects [15,27].Their independent relationships of BMI and FPI to the 2nd ISEC could be interpreted as having different pathways to affect 2nd ISEC. Interestingly, in the current study, there was a correlation between DBP and 2nd ISEC (r = 0.257, p = 0.044). This could be explained by the facts that IR is the center which connects BP on one end and ISEC on the other end. Both BP and ISEC are known to be related to IR (code reference). However, in study of Chiu et al, DBP was not selected into multiple linear regression analysis [19]. The difference might be resulted from different races, inclusive criteria, methods and study designs. A well-designed study with larger population size to clarify the role of BP in the estimation of 2nd ISEC is still needed. To our best knowledge, our study is the first one to develop equations using MetS components and FPI to estimate 2nd ISEC in subjects with wide range of glucose tolerance in Chinese. More importantly, validating for our equations using external validation group was also done. However, we do realize there are several limitations in the present study. First, WC, a more reliable index of central obesity than BMI, which were known to be associated with β cell function, was not measured in the study [28]. However, evidence showed that BMI was highly correlated with WC (r = 0.900 in men and r = 0.889 in women) in Chinese [29]. Moreover, Chiu et al. demonstrated that BMI is the better marker than waist-hip ratio to predict first insulin secretion [19]. Therefore, BMI could replace the waist circumference to predict first insulin secretion. Secondly, the FH of T2DM, which is also associated with ISEC, is not evaluated in the present study [30]. Thirdly, the population size in our study is relatively small. Given the fact that it is hard to measure 2nd ISEC, this is understandable. Further study with more subjects and wilder ranges of clinical-metabolic variables to validate our model is needed.
5. Conclusion
In conclusion, using Mets components, 2nd ISEC could be predicted with good accuracy (r = 0.650). After adding FPI into the equation, the predictive accuracy further improves (r= 0.738). We hope that these equations could be widely used in daily practice and would contribute to the early detection and find the proper treatment for diabetic patients.
Abbreviation
SI: Insulin sensitivity, T2DM: Type 2 diabetes, IR: Insulin resistance, 1st ISEC: First phase insulin secretion, 2nd ISEC: Second phase insulin secretion, PreDM: Pre-diabetes, MetS: Metabolic syndrome, BMI: Body mass index, TG: Triglyceride, HDL-C: High-density lipoprotein cholesterol, FPG: Fasting plasma glucose, FPI: Fasting plasma insulin, NGT: Normal glucose tolerance, M-LDGGI: Modified low dose graded glucose infusion test, WC: Waist circumference, HOMA-IR: Homeostasis model assessment of insulin resistance, HOMA-β: Homeostasis model assessment of the β–cell function
Competing Interests
The authors declare that they have no competing interests.
Author Contributions
Hsieh Chang-Hsun analyzed the data. Lin Jiunn-Diann wrote the manuscript. Wu Chung-Ze and Chen Yen-Lin reviewed and edited the manuscript. Pei Dee contributed to the discussion and edited the manuscript. Wei-Cheng Lian, Hsu Chun-Hsien, analyzed the data and contributed to the discussion.