


1. Introduction
Sustainability is the defining challenge of our time. With 4.4% of the world's population, the United States (US) consumes 19% of the world's primary energy production. Approximately 124 million residential and commercial buildings account for the largest fraction of energy consumption in the US at 45% of the primary energy (73% of all electrical energy), and constitutes a national $395 billion/year energy bill [1]. In the United Kingdom (UK), 39% of the total energy is consumed by buildings, and that figure is projected to increase annually by 1.7% to 2025 [2]. China, currently with 4.26x as many people as the US, surpassed the US in total energy consumption in 2000. It is estimated that, by 2030, 63% of building floor space in China and 65% in India will be newly constructed compared to a 2010 baseline [2]. With the maturation of developing economies, and the 0.902 correlation between energy consumption and quality of life [3], energy security challenges are expected to proliferate. Sustainability, and its connections to climate change and energy security, is expected to become increasingly important with time.
Addressing energy efficiency of buildings is often referred to as the “first fuel” since it is the largest sector of US energy consumption and building retrofits currently constitute the most cost-effective method to mitigate building energy consumption in the existing building stock. There are several industries built around the sustainability challenge within the US, including the $5+ billion/year [4] Energy Service Companies (ESCOs) Energy Service Performance Contracts (ESPCs) and $9.6 billion/year [5] Demand Side Management (DSM) services. The International Energy Agency (IEA) reports statistics from its 29-member countries that they have collectively avoided $5.7 trillion in energy expenditures since 1990, $550 billion in one year [6]. Worldwide investments in energy efficiency for buildings are estimated at $90 billion with remaining market potential of $70- 130 billion in the US alone [4]. New technologies for cost-effectively addressing this market potential are needed.
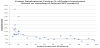
Currently, almost all building efficiency projects rely upon a manual walkthrough by a certified individual to collect building audit data prior to providing recommendations or financing for energy efficient retrofits. There are currently 124 building energy software tools [7] aimed at partially automating tasks before, during, or after the audit process. Some of these tools allow cost-effective optimization for combinations of up to 3,000 energy conservation measures (ECMs) that could be applied to a building if a software description of that building exists. Predictive accuracy of such a model is enhanced if it can be calibrated to measured data. Several specifications including Annex 53 [8], International Performance Measurement and Verification Protocol [9] and ASHRAE Guideline 14 [10] define qualitative or quantitative criteria for a legally useful software description of a building. Models which meet such criteria is often a contractual requirement and may be used to establish the risk associated with project financing. However, an internal survey of ESCOs participating in the Federal Energy Management Program (FEMP) has shown that developing and calibrating a building energy model for a project below $2 million is not cost-effective, with the percent of total project size varying from 6-48% to create an accurate software model as shown in Figure 1. This results in building energy models being used only 8% of the time. Software capabilities that can generate an accurate model of a specific building from open or readily available digital information sources are needed. This would not only reduce manual effort for larger building projects but also allow market growth into smaller buildings.
2. Background
2.1 Facilities
ORNL’s Building Technologies Research and Integration Center (BTRIC) has and currently operates several buildings, commercial and residential, as research facilities for testing energy efficient technologies. To remove the confounding variable of human behavior, the buildings are robotically emulated for control of lights, TV, thermostat, shower, clothes washer and dryer, opening/ closing refrigerator doors, and human emulation (i.e. heat/moisture generation) in different rooms as defined by benchmarks based on human time of use studies. This allows a cleaner, full-scale, realworld comparison among different (prototype) technologies for the same occupancy, building, and heating/cooling season. The data from these buildings range from approximately 100-650 sensor channels per building; they are measured from standard sensors or devices termed internet of things (IoT), and communicated through the data acquisition system to a centralized web server. The data is typically polled every 5-10 seconds and aggregated for storing the data at 30 second to 15- minute resolution, depending on the needs of the experiment. There are several software tools built on top of this data for automated quality assurance and control (QA/QC), alarm notification to experimenters for sensor health issues, aggregation of hourly to monthly trends, dashboards for visualization, download systems for selecting data of interest to common data formats, and provenance systems for tracking use of data elements over time.
The authors are thankful to the Oak Ridge Leadership Computing Facility (OLCF) and eXtreme Science and Engineering Discovery Environment (XSEDE) which have provided high performance computing (HPC) resources and expert support for eight HPC machines.
2.2 Calibration
The Autotune project began in 2011 with the goal of creating a fully automated calibration process for calibrating a building energy model so that simulation output matches measured data within ASHRAE Guideline 14 requirements. The project has been able to identify an automated algorithm that surpasses the 30% error requirement for hourly data with an average error rate of 3.6% for 20,000 buildings, documented methods in over 30 peer-reviewed publications (bit.ly/ autotune_science), and made the code open-source on GitHub (bit. ly/autotune_code) via the permissive UT-Battelle license for free commercial use.
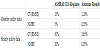
The best-performing algorithm of the 130,000 tested on 20,000 buildings in terms of accuracy, speed, and robustness for general building calibration was a variant of the Non-Dominated Sorting Genetic Algorithm II (NSGA-II). NSGA-II is an evolutionary algorithm which was modified to use islanding where potential solutions could migrate between a fast-evolving island of fitness evaluations using 4 days of data vs. a slower and more thorough evaluation of fitness using a full year’s data [23]. We leverage the NSGA-II algorithm identified in this previous work to quantify the calibration performance for each building type as part of this study (Table 1).
Relevant background for this paper include the 260 m2 (2800 ft2) home in the Wolf Creek subdivision of Oak Ridge referred to as WC4 [11]; autonomous QA/QC with gap-filling by throwing away existing data and measuring how well different statistical [12], filtering [13], and machine learning [14] techniques to automatically handle questionable data; and over 130,000 parallel algorithmic instances of artificial intelligence (AI) algorithms were investigated using multiple HPC resources and over 200 university Linux machines to assess the robust, accurate, and timely calibration of building energy models [15] under multiple conditions (e.g. building types, tunable parameter conditions, number and resolution of data channels) defined by benchmark calibration tests.
The 130,000 AI instances included tests using the following classes of algorithms: linear and non-linear regression, feed forward and recurrent neural networks, C- and K-means clustering with localmodels, support vector machines, Gaussian mixture models, selforganizing maps, regression trees, time modeling, and genetic algorithms. Ensemble learning was used where output of one algorithm would serve as the input of another to create a tree of AI algorithms referred to as a hierarchical mixture of experts. Multiple algorithms in each class, or combination of algorithms, was explored using multiple meta-parameter settings (e.g. learning rate, activation function, number of individuals) to define the individual “AI instances” tested in previous work [15,19]. To leverage the project for more general scientific challenges, the authors created 2 core capabilities that require data mining for actualized building energy savings. The 2 core capabilities are:
2.2.1 HPC Simulation
The world’s #1 fastest buildings simulator, a software package referred to as AutoSIM designed on OLCF’s Titan supercomputer (at the time the world’s fastest and now the nation’s 2nd fastest at the time of this writing), was developed with the ability to compute 524,288 annual building simulations and write 45 terabytes (TB) of data to disk in 68 minutes [16]. Two-thirds of this time was spent writing the results to disk, which consisted of 96 channels of simulation results at 15-minute resolution for a year (~35MB) for each building. This was developed to support full HPC scalability for a built-for-desktop executable so long as instances of a simulation are independent and require HPC resources in order to achieve a time-to-solution constraint for project success. The repeated application for large-scale sensitivity analysis, uncertainty quantification, and calibration studies resulted in over 8 million simulations and 200TB of simulation “big data” to be data mined for the purposes of improved calibration.
This capability has now been leveraged for simulating building energy models for over 130,000 buildings in Chattanooga, TN in partnership with the electric utility. A digital twin of the utility was created to assess the energy, demand, emissions, and cost savings for every building in their area and aggregate this to utility-scale savings. To date, this capability has been leveraged for over 2.5 million simulations totaling 12TB with the ability to turn-around buildingspecific savings for each of 135,481 buildings in 6.5 hours [17,18].
The simulation data is then post-processed to show impact on critically-loaded feeders, substations, and entire utility along with visualizations to make this big data analysis more intuitively understood by leveraging interactive, web-based visual analytics.
4.2.2 Science automation
In many respects, science can be considered a search through the space of possible models to find one that sufficiently describes observables. In order to automate this search, the team developed an HPC-capable suite of model-creating (i.e. machine learning) algorithms which could compute and report figures of merit regarding memory overhead, computation time, cross-validated result accuracy, and robustness to inform selection of the best algorithm for a set of benchmark problems. This software suite of machine learning algorithms, we refer to as MLSuite [19], is composed of proprietary, open source, and theoretical extensions [20] to machine learning algorithms underneath an eXtensible Markup Language (XML) interface that has been used to simultaneously run over 100,000 instances of (variants or ensembles of) 10 machine learning algorithms in parallel on 2 supercomputers and 218 Linux-based compute resources identified by internet protocol addresses. Instead of performing a limited search based upon an investigator’s knowledge of the capabilities and deficiencies of individual AI algorithms, MLSuite allows a much more extensive search to find/generate the best function that maps one set of data to another.
3. Research Study
Previous research reported less than 40% correlation [21] between matching an experiment with 8,760 data points (e.g. hourly electric utility bills required by ASHRAE G14) and an accurate input file for a simulation (e.g. software description of a building). The purpose of this study is to assess multiple calibration algorithms to quantify the accuracy for each commercial building type in terms of matching whole-building electrical energy use as well as a recently-developed technique that can be used to assess how accurately a calibration procedure recovers the true building parameters. We explicitly do not address QA/QC procedure, but acknowledge that data which has not been curated could result in a worse, rather than improved, model if used in calibration.
3.1 ZEBR alliance WC4
The experimental facility used for this study employed several energy-efficient technologies that were compared against the other 3 residential buildings in the subdivision for assessment of energy savings. The previously unpublished details of the WC4 building are as follows.

3.2 Sensors
For our experiment, there were 249 channels collecting 15-minute data on physical properties of the building. While each sensor’s transmitting device, final channel/location (i.e. column of a spreadsheet), technical specifications, long description, physical location, and responsible investigator are recorded, only the aggregated sensor types are reported here.

3.3 Combining sensor data with simulation
A common situation in many domains is that simulation engines often do not capture (as inputs) or report modeled data (as outputs) all the fields of interest to subject matter experts. It is well known that records of average material properties (e.g. ASHRAE Handbook of Fundamentals), manufacturer labels or technical specifications on products shipped, and calibrated laboratory measurements of the materials can report significantly different values relevant to the accurate simulation of that material.
There are currently 58 whole-building simulation engines [7] which typically use physics-based calculations to estimate the energy consumption of a building based on a building description and weather data. In this study, we use EnergyPlus, DOE’s flagship whole-building simulation product. An EnergyPlus input file typically contains approximately 3,000 inputs that describe the material components, occupancy and equipment schedules, systems, and other details necessary to perform reliable energy calculations. Depending on the needs of a project, subject matter experts can encode uncertainties (e.g. minimum, maximum, distribution, and mathematical constraints) of simulation inputs. An online system was created to test calibration for EnergyPlus simulations used in this study. This capability was used to identify what combination of material properties throughout the building could explain the multiple signal signatures detected. In this experiment, we focused on 108 simulation inputs which are summarized as follows: (1) Material properties (thickness, conductivity, density, specific heat, thermal absorptance, solar absorptance, and visible absorptance), (2) Window glazing (U-factor and solar heat gain), (3) Zone infiltration, and (4) Shadow calculations.
It is common for simulation engines to not output the type or resolution of data for all sensors placed in an experiment. In this study, we look at different types and resolution (monthly vs. hourly) of sensor data from the facility and describe these in the context of the following experiments.
4. Experiments and Results
The team of building experts qualitatively identified the parameters that were believed to most impact energy consumption of a building. These inputs were then manually defined as having a minimum and a maximum physically-realistic range that one would typically see in today’s buildings. A subset of these parameters was occasionally grouped in order to vary whole-building infiltration, lighting density, or plug load density rather than doing so individually by thermal zone (i.e. a room in the building). These parameters and ranges were then used as uncertain inputs to be recovered by calibrating the building energy model to measured data. A summary of the work for each building type is shown in the following table.

The calibration process for each building type was conducted using simulation from world-class high performance computing facilities. The electricity use in Joules for both monthly and hourly was calibrated by modifying simulation inputs within the allowable ranges with calibration accuracy plotted for different calibration algorithms that were tested. The box-and-whisker plot of results, shown in the tables below, indicate that calibrating to a specific variable (e.g. electricity use, Figure 2) is not highly correlated with accuracy in other (uncalibrated) energy use (e.g. natural gas, Figure 3).
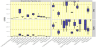
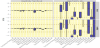
The largest mean hourly CV (RMSE) was 15.84% (Large Office) while the next highest was under 10%. The average hourly CV (RMSE) was 3.9% (less than 30% required by ASHRAE G14) and average monthly CV (RMSE) was 1.12% (less than 15% required by ASHRAE G14). The NMBE for all buildings was within 1.2% for both hourly and monthly. The natural gas results also serve as a frame-of-reference for how far off an uncalibrated simulation could be compared to a calibrated simulation.
Current industry guidelines, protocols, and the basis for financing projects based on uncertainty of model-predicted savings is, as of the time of this writing, solely based on the model’s ability to match measured energy use. However, this research is informing the process of an update to ASHRAE Guideline 14 and helped develop a new standard method of test to evaluate the model in terms of what matters most – its ability to accurately characterize the real building. The team has contributed to and used ANSI/RESNET Standard 1201 [22] to conduct large-scale tests of various calibration algorithms on the recovery of the actual building properties (e.g. ceiling insulation level) through the process of modifying inputs so that simulation output matches whole-building electrical energy consumption. In the following figure, the minimum, mean, and maximum of an ensemble of calibration algorithms was assessed. It can be seen that the best models produced by the best calibration algorithms (min row at bottom) have virtually no error in matching a tunable parameter to the building’s true parameter value (e.g. insulation R value), with a mean ranging between 16% and 30%, and a maximum of nearly a factor of 2. It should be noted that the maximum error is strongly constrained by the minimum and maximum values allowed for each tunable parameter.
5. Conclusion
Eight supercomputers, including 2 high performance computing resources that were the world’s fastest, and 218 Linux machines were used to test 130,000 artificial intelligence algorithms in parallel for the calibration of building energy models to measured data. While calibrated models from most algorithms were within the range specified by ASHRAE Guideline 14, uncalibrated energy use can remain significantly different. More importantly, the actual input parameters that characterize the building can often be tuned between 15% and 32%. Further research is needed to identify robust calibration algorithms, ensemble approaches, or post-processing techniques to drive this input-side error down further. By doing so, industry can recover a reliable software model of a building from electrical use for securing favorable financing terms, setting guaranteed savings rates in performance contracts, and making the world’s built environment more energy efficient.
Competing Interests
The authors declare that they have no competing interests.
Acknowledgments
This work was funded by field work proposal CEBT105 under DOE Building Technology Activity Number BT0201000. This research used resources of the Oak Ridge Leadership Computing Facility at ORNL, which is supported by the Office of Science of the DOE under Contract No. DE-AC05-00OR22725. ORNL is managed by UT-Battelle, LLC, for DOE under contract DE-AC05-00OR22725. This manuscript has been authored by UT-Battelle, LLC, under Contract Number DEAC05-00OR22725 with DOE. The United States Government retains and the publisher, by accepting the article for publication, acknowledges that the United States Government retains a non-exclusive, paid-up, irrevocable, world-wide license to publish or reproduce the published form of this manuscript, or allow others to do so, for United States Government purposes.