


1. Introduction
Fuel prices have been steadily rising and are expected to continue well into the future; as a result fuel efficiency has become one of the main priorities within civil aviation. To further improve efficiency, airlines are branching out to different technologies which promise stepped improvements in an aircraft’s flight characteristics.
Hybrid Laminar Flow Control (HLFC) systems are employed and a new system is designed and analyzed to show the impact of these systems on an aircraft’s efficiency. Hybrid Laminar Flow Control uses a system consisting of ducts and compressors to suck the slowest section of the boundary layer through a carefully designed porous skin at the leading edge of the wing, wingtips or nacelles to suppress instabilities in the airflow and delay the transition to turbulent flow. Since turbulent flow produces up to 10 times more skin friction as laminar flow, HLFC improves the aircraft’s performance by reducing the drag, leading to an improved lift/drag ratio which can save fuel, weight or can allow for a larger payload to be carried, all of these factors improve the marketability of the aircraft.
Hybrid Laminar Flow Control is a technique used to delay the transition of air over the aircraft surface from laminar to turbulent flow which has many performance benefits for the aircraft. Before studying laminar flow techniques, the causes of turbulence are reviewed. Transition from laminar to turbulent flow is caused by instabilities in the boundary layer of which there are three main types; Attachment Line Transition (ALT), Crossflow (CF) and Tollmein- Schlichting (TS); these are discussed in the following sections.
Attachment Line Transition occurs at the leading edge of a swept wing. A 2D airfoil has a stagnation point at the leading edge where the flow splits to flow above or below the airfoil. On a 3D wing these stagnation points form a line called the ‘attachment line’. As the sweep angle of the wing increases, there is an increasing velocity component along the attachment line. If the momentum-thickness Reynolds number along the attachment line exceeds a critical value, found to be around 100, the flow will become unstable and become turbulent [1]. Thus all flow both outboard and aft of the critical point will be turbulent.
Attachment Line Transition is mainly dependent on sweep angle, the momentum thickness Reynolds number of the attachment line, leading-edge radius and surface roughness; each of these factors must be kept as low as possible to reduce the instability.
Cross flow instability is a dynamic instability which predominantly occurs in the first 10% of the chord where the span wise flow is the greatest. The span wise flow is relatively constant but the chord wise flow changes velocity quickly as the flow accelerates over the wing. This causes an imbalance between the pressure and centrifugal forces creating a boundary layer velocity distribution normal to the local external streamline creating co-rotating vortices [2]. Cross flow is dependent on the sweep angle and pressure gradient; higher speeds and increased sweep angle causes transition to move forward and also means that the laminar boundary layer is more sensitive to surface conditions and the critical Reynolds number is reduced [3].
Laminar flow techniques can be used on wings, engine nacelles, fins and horizontal stabilizers. The benefits of laminar flow control are increased with aircraft size and are maximized for all-wing aircraft [4].
Natural Laminar Flow (NLF) is a passive technique whereby the shape of the wing aerosol is designed to accelerate the flow across the chord of the wing and create a favorable pressure gradient to delay transition due to TS instability amplification. With 2D instabilities only a positive pressure (favorable) gradient is required for them to be suppressed. The airfoil is such that the favorable gradient is maintained as long as possible, often over 50% of the chord. Also there is no leading edge pressure peak because of the reduced leading edge radii [5]. Hybrid Laminar Flow Control was developed combining the advantages of both systems. The airfoil is modified so that the pressure distribution has a favorable pressure gradient for as long as possible and the complex suction system of LFC is limited to the area forward of the front spar which includes all areas of highly 3D instabilities and some of the TS instabilities also; his reduces both the suction requirements and the system complexity. Providing access for maintenance is simplified by using Krueger flaps as the high lift device which when opened provides access to the complete system. The favorable pressure gradient aft of the front spar suppresses the 2D instabilities after the suction region. Active (powered) suction removes the slowest part of the boundary layer which modifies the boundary layer velocity profile in a way that reduces viscous friction [6].
The attachment line is the area of the highest 3D instabilities and therefore requires the highest amount of suction for a given area. By definition the attachment line is at the leading edge where pressure is typically at a maximum; this is approximately at the wing highlight but varies slightly at different flight conditions. Localised areas of passive (unpowered) suction of the attachment line can be achieved by ducting from this region to the low pressure region on the underside of the wing to automatically produce suction [7]. The passive suction region can work in conjunction with the active suction of a HLFC system and is used to ensure that the attachment line is laminar before it enters the active suction region. Here, a HLFC system is designed and investigated which includes regions of passive suction as described above.
2. Laminar Flow System Design
2.1 Typical layout
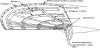
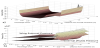
In order to achieve the correct levels of suction at all locations in the suction zone, a fairly complex system is required. Figure 1 shows a typical HLFC set-up. Although different systems vary, they all contain some form of the following components; a porous skin, skin substructure, collection chambers, pressure restriction control system, ducting, turbo compressor and a power source [6]. Other considerations which are required in the design stage are high lift devices, anti-ice devices and anti-insect devices. The main aspects are discussed in the following sections.
The skin defines the external shape of the wing and its careful design can improve the efficiency of the system. Small changes in the shape of the aerofoil at the leading edge can have a large impact on the initial pressure gradient which is one of the main parameters in determining the suction requirements [7]. The skin must be made of a suitable material and must be porous to allow air to be sucked through into the collection system. Additional requirements of the skin are that they must be resistant to bird strike and have the ability to maintain their shape and transfer the forces under aerodynamic loading. Furthermore it must have a good surface finish so that transition is not prematurely triggered by any roughness of imperfections.
As a result, perforated Titanium is typically used because it has many positive characteristics [8]; it has good erosion resistance and can be surface treated to prevent corrosion so it does not require painting (painting the outer skin is not possible or the perforations would be blocked). It is lighter than Stainless steel and stronger than Aluminium meaning that thinner skins can be used [9].
Due to unresolved issues regarding the damage detection and repair of carbon fibre, it is not typically used. Composite manufacturers are developing inherently porous material which may become the material of choice in future years as it has the potential to reduce the complexity and weight of the design; the thickness of the material could be varied to control the amount of suction produced along the wings.
At metallic skin must be made porous; this is typically done by drilling an array of holes using either the electron-beam-drilling or laser-drilling techniques. Both techniques produce round, slightly conical holes with a diameter of around 50μm at a rate of 3000 holes per minute. Considering that Billions of holes are required for one wing alone, this is still a long and expensive process.
As shown in Figure 1, the volume between the outer skin and inner skin is divided by stringers to make span wise flutes, which guides the air which has been sucked through the porous skin into collectors which are evenly spaced along the suction surface. These stringers also act to strengthen the skin by adding a strong substructure. These flutes lead to collection chambers. Ducts are used to transfer the sucked air from the collection chambers to the turbocompressor. These ducts must be as small as possible to avoid taking up too much valuable space, yet large enough to keep pressure losses low. These ducts merge and lead to a turbocompressor which serves two functions, firstly, to provide the required mass flow rate, and secondly to increase the pressure of the air so that it can be exhausted at the correct pressure (atmospheric pressure).
2.2 System design
Initially, the location of the active suction region was determined. As per typical HLFC design, the system would be installed forward of the front spar. For this article, the specimen wing had the front spar at the 15% chord for a majority of the wingspan, this decreased to 10% where there was a kink in the trailing edge of the wing. The span wise boundaries of the active region is limited by the size of the turbocompressor, therefore the exact sizing of the active suction region was not finalized until later in the analysis, to be optimized for the turbocompressor; the final active system ran from 15.5m to 30m from the aircraft centerline.
The passive suction area is located at airfoil highlight at the inboard end of the active region so that the attachment line Reynold’s number is brought below the critical value before entering the active region to reduce the suction/power requirement.
In typical designs, the wing is divided into 3 regions according to the type of instability which is most prevalent in that location. When employing the passive suction device, the ALT active suction is not required and the active suction area is split into two. The cross flow zone is defined as the suction surface in front of the 8% chord line on the upper surface and to the 2% chord on the lower surface where the CF instability is most prevalent, and the Tollmein-Schlichting suction zone is the suction surface aft of the 8% chord line on the upper surface.
It was necessary to choose a wing airfoil which displayed the required pressure characteristics of an HLFC airfoil. Epplerairfoils and NACA 6 and 7 series airfoils were tested using XFOIL and NACA747A315 was found to be best suited for the predicted cruise conditions featuring a rapid initial acceleration so that suppressing the crossflow instability does not require intensive suction.
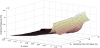
Using ANSYS, a CFD model was developed to evaluate the external pressures acting on the surface of the wing at cruise conditions. Pressure distribution plots were taken at 0.5 m intervals between 15 m and 32 m from the aircraft centerline. There was found to be a favorable pressure gradient up to beyond the 70% chord point when the 3D airfoil was analyzed which will suppress any TS instability aft of the suction region up to this point unless the critical Reynolds number has been exceeded before this. The pressure distribution for the active suction region can be seen in Figure 2; the plot shows the dramatic increase in pressure at the leading edge. Using these external pressures boundary layer and stability theory calculations are used to determine the suction flow rates required to delay transition1. The amount of suction applied is important; if suction is too low, it will not be enough to prevent transition, however if it is too high then the flow into the holes become more three-dimensional and has a higher effective surface roughness which will cause premature transition.
2.3 Suction method
2.3.1 Overall suction coefficients
Areas of highly 3D instabilities are counteracted by greater local rates of suction therefore the ALT passive suction area and the crossflow area require the most suction. To calculate the level of suction required the suction coefficient, Cq, is first calculated where a higher value of Cq indicates a greater rate of suction. The suction coefficient for each zone is a function of chord length and so must be calculated individually at each spanwise location. The suction surface was divided into 34 spanwise sections of length 0.5 m, and 45 chord wise segments with an approximate length of 0.37% chord. This made a total of 1530 elements with areas proportional to the chord length. The crossflow zone consists of segments 1 to 26 and the Tollmein- Schlichting zone consists of segments 27 to 45. In the following sections the suction coefficients for the different zones are calculated. The passive ALT suction is only required between 15 m and 15.5 m from the aircraft centerline, therefore the calculation has been done for this location and is shown in the following section. The HLFC system is optimized for operation during cruise and so the suction requirements are for the cruise condition.
Anscombe and Illingworth [3] provide equations for calculating the suction coefficient required at the attachment line zone. The attachment line velocity, acting from wing root to tip, is given by:
WAL = -0.0032(ΔPI)2 + 1.3048(ΔPI) + 38.799 = 85.87m/s
The stream chord Reynolds number, ReC, is calculated as given by:
whereVTAS and ν are true air speed (243.16 m/s) and kinematic viscosity of air (3.7754 x 10⁻⁵ m2/s) respectively, calculated at cruise conditions in a standard atmosphere. c is the chord length (8.05 m). With the sweep angle, Λ, the attachment line momentum thickness Reynolds number can be calculated from:
This is far higher than the critical value of 100 so the attachment line will be unstable at this point. Three sub-coefficients (CqALA, CqALB, CqALC) are used to calculate the final attachment line suction coefficient. They are calculated using:
CqALA = 64226.75 Re2θAL = 1.54 × 10¹⁰
with the same method:
CqALB = -1.41 × 10³
CqALC = -1.79 × 10⁵
and are combined as follows:
Anscombe and Illingworth [3] provide further equations for calculating the suction coefficient required at the crossflow zone. Four suction sub-coefficients and the chord Reynolds number are required. The stream chord Reynolds number, Rec, is given by Eq. (2); the subcoefficients are functions only of the sweep angle and so are the same for all spanwise locations. The sub-coefficients are calculated using Eqs. (8 to 11):
CqCF1 = (2.687 × 10⁻¹³Λ2 + 6.352 × 10⁻¹¹Λ-1.03110-9 = 1.86 × 10⁻⁹
and therefore:
CqCF2 = 3.97 × 10⁻⁷
CqCF3 = 2.47 × 10⁻⁵
CqCF4 = 4.34 × 10⁻⁴
The overall crossflow suction coefficient is given by:
CqCF = CqCF1(Rec X 10-6)3 + CqCF2(Rec X 10-6)2 + CqCF3RecX10-6 + CqCF4
The Tollmein-Schlichting instability is independent of the leading edge geometry and the flight condition. Only a small amount of suction is required and a typical value of 2 x10⁻⁴ is found to be enough to suppress the 2D instability.
2.3.2 Volume and mass flow rate
The suction coefficient is linked with volume flow rate as follows:
Q = CqV∞S
Where S is the surface area of the suction surface (m2) and V∞ is the free stream velocity (m/s). Cq refers to the local suction coefficient. Furthermore, by multiplying by the air density, the mass air flow through the surface could be calculated for each element.
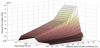
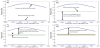
The variation in volume flow rate for the active suction zones can be seen in Figure 3. Since the volume flow rate is a function of suction area and Cq and both of these are factors of the chord length the flow rate required is less when closer to the wing tip. The flow rate required has been ramped up to the calculated value rather than an instant change. This is in case a sudden change in the amount of suction induces turbulence rather than suppressing it.
The suction surface was designed as a corrugated fiberglass skin substructure bonded to a perforated titanium outer skin. The fiberglass substructure is lightweight but rigid enough to transfer the flight loads and allows for an electric blanket anti-icing system to be used. Regarding anti-insect devices, an anti-insect spray will be installed in the Krueger flap which when coupled with the flap acting as a deflector provides sufficient protection against insect debris.
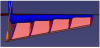
The perforated skin will be drilled from the inside surface to eliminate the problem of insects or dust being lodged in the holes and to avoid any undesirable effect, the holes will be drilled perpendicularly to the surface. To give a reasonable compromise between flute size and substructure strength, a flute width of 9.5 mm has been used near the leading edge where higher impact strength is required; the width is 15 mm when away from this area. A schematic is shown in Figure 4. The width of the stringer will be the same as the flute width to give the heat from the electric blanket as much area to conduct through without blocking too much of the suction space. With this substructure design, the effective suction area is halved, therefore the suction coefficient values must be doubled in the remaining suction area so that the required volume flow rate is maintained [9].
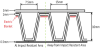
To give a reasonable compromise between flute size and substructure strength, a flute width of 9.5 mm has been used near the leading edge where higher impact strength is required; the width is 15 mm when away from this area. A schematic is shown in Figure 4. The width of the stringer will be the same as the flute width to give the heat from the electric blanket as much area to conduct through without blocking too much of the suction space.
2.3.3 Optimization of the perforated surface
The perforated skin is the boundary between the external pressure, defined by both nature and the flight condition, and the flute’s internal pressure. The internal pressures along the flutes can be determined by design; by sizing the turbocompressor and the ducting to set the internal pressure in the collectors as required. It is essential that the pressure drop across the porous skin is the same as the pressure drop needed to achieve the required level of suction calculated in the previous section. The sizing and spacing of the holes in the perforated skin can be varied to ensure that this pressure drop is achieved. In order to do this it is necessary to understand the link between the perforation geometry and spacing, and the resulting pressure drop across the skin. The equations used for this are given in the following section.
It is also necessary to know how the pressure inside the flutes varies between the collectors of known pressure. For the design of the perforated skin in this article it has been assumed that the pressure within the flutes varies linearly between collectors; any errors in this assumption will not affect the system architecture and can be resolved by re-optimizing the hole configuration once a more accurate understanding of the between-collector pressure drop is understood.
The design of a perforated surface has limitations. Firstly, current hole-drilling technologies (laser-drilling or electron-beam drilling) are limited to a minimum hole diameter of 50 μm in a 1 mm sheet of titanium. Secondly, to maintain the structural integrity of the skin, the spacing ratio of the perforations must be greater than five. Finally, the maximum hole velocity, VH, is limited to 40 m/s; a velocity greater than 50 m/s will result in premature transition because the effective roughness would be too high, 40 m/s is a safer limit 10. Local suction coefficient can be shown as:
Where VS is the effective velocity through the skin, perpendicular to the skin (m/s). VH, can be calculated using:
Where G is the porosity of the perforated surface defined as:
Where N is the spacing ratio; the ratio of the distance between holes from center to center (m) and the hole diameter, d (m).
With VH and the hole geometry determined, the mass flow rate of air through an individual hole, m., (kg/s) can be calculated using:
m. = ρVH A
where ρ is the density of the air (kg/m3) and A is the hole area (m2) given by:
The pressure drop, Δp, (Pa) across the skin is then calculated using:
where ν is the kinematic viscosity of air (m2/s), t is the skin thickness and Y is given by:
where Kd is the ratio between the effective hole diameter and the measured hole diameter which for laser-drilled holes is stated as 1.3 (Ref. 6). X is found using:
Where μ is the dynamic viscosity of air (kg/ms). The aim of optimizing the perforated surface is to vary the hole spacing to achieve the required pressure drop whilst ensuring the hole air velocity and hole spacing limits are not exceeded.
3. Results and Discussion
Recognized high speed flow controllers are passive, active and hybrid methods for a range of activities from a delay shock induced separation to transition from laminar to turbulent flow [10,11]. Tetrahedral Vortex Generator is an example of a passive method to delay separation over an air foil [12] where here a hybrid suction method is applied for delaying a transition from laminar to turbulent flow.
3.1 Active suction region
Each collection chamber was divided into sections so that different areas of the collector can have different internal pressures; each section corresponds to a certain number of flutes. In order to keep the number of chamber sections to a minimum it was essential to make sure that the collectors were split in the most efficient way.
Firstly the maximum pressure drop through the skin was calculated using the maximum allowable mass flow rate through an individual hole (40 m/s) with a hole diameter of 50 μm and a material thickness of 1 mm at cruise conditions. Using an iterative process, the maximum pressure drop across the skin was calculated as 6200 Pa. Furthermore, given the mass flow rate through an individual hole and knowing the required mass flow rate through a given element it was possible to determine the required hole spacing, Sp, (m) to produce this pressure drop using:
Figure 5a shows how the spacing ratio varies for a given hole velocity. By comparing this to Figure 3 it can be seen that the spacing ratio is a function of the inverse of the mass flow rate. The spacing ratio is greater than 5 at all positions showing that it is possible to meet the design requirements. Figure 5b shows the difference in pressure between the external pressure and the flute pressure; the difference is due to the pressure drop caused by the perforated skin.
To find the lower VH limit, the calculations shown above were repeated for lower values of VH to find the point at which the spacing ratio falls below 5. This was found to occur at VH=7 m/s. A conservative lower VH limit of 10 m/s was used which meant that the spacing ratio would always be above 6. The pressure drop associated with this VH was calculated as 1445 Pa. Figure 6 shows the pressure variation between the external pressure and the internal pressures when using the upper and lower VH limits of 40 m/s and 10 m/s respectively. Provided that the target internal (flute) pressure is within these limits then it is possible to meet the hole spacing requirement while being lower than the maximum allowable through-hole speed of 40 m/s.
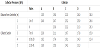
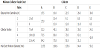
Based on these calculations, by making sure that the collector pressures and the pressure along the flutes between the collectors are between the pressure associated with VH=10 m/s and VH=40 m/s then the hole spacing and VH requirements will always be met. It was found that each collection chamber had to be divided into a minimum of five sections to be within these limits. These target flute internal pressures were determined and are shown in Figure 7. The collection chamber section pressures required for this are recorded in Table 1; adjacent collector sections which have identical collector pressures have been combined. The through-hole velocity therefore varies between holes but never exceeds the upper and lower limits of 40 m/s and 10 m/s.
3.2 Passive suction region design
The process of designing the passive suction perforated surface is similar to that for the active suction surface and the equations and design limitations are identical. The automatic suction system has two porous skins, the suction skin at the leading edge and the exhaust skin on the underside of the wing. The suction surface, which has the same substructure at the active suction skin, is located at the highlight, adjacent to the active suction section so the stabilizing effect is made to the attachment line before it reaches the active suction region; it is connected to the exhaust surface on the underside surface via a duct.
The attachment line suction coefficient was previously calculated as 3.4x10⁻³. The height of the attachment line above and below the highlight was initially set at approximately 50 mm but was later slightly adjusted so that the external pressure at the top and bottom of the suction region was the same. The passive suction area was found to be 0.063 m2, this was the area used for the exhaust also. Therefore, the optimum volume flow rate is 0.0523 m3/s and VS calculated as 1.25 m/s for both the suction skin and the exhaust. By taking the density of air at cruise to be 0.3796 kg/m3, the mass flow rate can be calculated as 0.0199 kg/s.
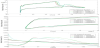
The external pressure at the suction surface is plotted in Figure 8a. The lowest point on the pressure distribution for the lower wing surface occurs at approximately 75% chord which is just in front of the rear spar so this was the location for the exhaust. The pressure at this location is 18880 Pa and is shown on Figure 8a as a horizontal line. The difference between the pressure at the suction and exhaust skin is what causes the automatic suction.
The hole diameter and spacing for the 1 mm thickness exhaust skin was taken as 50 μm and 250 μm respectively so that the spacing ratio is greater than five to maintain material strength. The pressure drop across the exhaust skin is found 6140 Pa which means that the pressure at the internal side of the exhaust skin must be approximately 25000 Pa as shown in Figure 8b.
Following this the pressure loss along the duct was calculated. The duct was sized at 2” so that a standard pipe could be used. A 1” pipe diameter was first tested however with the given volume flow rate, the velocity in the duct, V, was 103.2 m/s which exceeded 0.3 Mach which was undesirable. A diameter of 2” was more appropriate at 25.8 m/s. Furthermore, a lower velocity results in a lower pressure drop along the duct. The duct pressure loss was calculated using:
Where L is the duct length, D is the duct diameter (m) and f is the duct friction factor.
3.3 System Integration into the Wing
Sizing the ducts is a compromise between size and velocity of airflow. To determine the velocity limit, the speed of sound and Tambient are calculated using standard equations. It is found that the speed of sound in the duct was calculated as 314 m/s and therefore the duct air velocity was limited to 94.2 m/s to avoid incompressibility issues.
It was decided to have one main duct to serve every collector section rather than one duct dedicated to each collector section to reduce the overall size of the ducting, however to make this possible there would have to be intermediary ducts with built-in pressure reducing features to make sure that the one duct could provide the required amount of internal pressure to the individual collection chamber sections. The configuration is shown in Figure 9. The main duct was located in the top corner of the leading edge and could be secured on the front spar to be well out of the way of any mechanisms and to prevent any vibrations. The intermediary ducts contain replaceable pressure filters which would also be porous sheets similar to the outer skin except with larger holes to ensure that there is no clogging of insects or dust. Since the pressure in the duct is defined by the turbocompressor’s inlet pressure and the duct losses, the required pressure drop across the filter could be calculated based on the target collection chamber pressures shown in Table 1. As strength and turbulence is not an issue with the filters, there are no limits to the material thickness, hole spacing ratios or the hole velocity and therefore the designer has enough freedom to produce the required pressure drop.
To determine the size of the ducts, an assumption was made that air sucked through the porous skin will then be sucked towards the nearest collector. Using this assumption, the volume flow rate through each collector section was calculated using the data calculated previously. Knowing the volume flow ratethe minimum duct sizes were calculated and are shown in Table 2.
The power, P, in Watts required for a turbocompressor can be found using:
Where Δp is the difference in pressure across the turbocompressor (Pa), η is efficiency and Q is the volume flow rate of air normalized to sea level conditions (m3/s). Normalized volume flow rate is calculated by dividing the flow rate at cruise conditions and dividing this by the ratio of density at sea level to density at cruise conditions. Using Eq. (24) and assuming a turbocompressor efficiency of 0.8 and a motor efficiency of 0.95, the maximum power required per wing for the turbocompressor is 7.26 kW.
Wfo(Δfp) can be calculated using:
where Δfp is the rate of fuel used due to the power off-take required for the turbocompressors. sfc, t, g and r are as before. Δfp can be calculated using:
Δfp = Δ(sfc) × TNET
Where Δ(sfc) is the increase in engine SFC due to the system, and TNET is the net thrust for cruise. The net thrust at cruise for the aircraft is 84 kN and the increase in SFC was found to be 1.3772x10⁻⁹ kg/Ns by running a TURBOMATCH simulation of the engine in cruise and increasing the off-take by 7.26 kW (i.e. the power required per wing for the HLFC system). Therefore Δfp is calculated as 11569 kg/s and Wfo(Δfp) is 82.2 N.
In the HLFC system the drag reduction must be subtracted from the ram drag to get the total change in drag.
From previous calculations, the mass flow rate of air taken in by the system is 1.015 kg/s. The ram drag can be calculated as follows:
dram = m × VTAS = 1.015. × 243 = 246.8N
As previously calculated, the drag saving per wing is 2176 N so the overall change in drag is given by:
∆d = dram - 2dwing saving = 246. - (2 × 2176) = -4106N)
With all parameters WT can be used to calculate as:
WT = 6148.4 + 2790.6 + 82.2 - 42926 = -35248.8N
The fact that WT is both large and negative shows that the advantage of the drag reduction significantly surpasses the disadvantages of the system weight and fuel penalty. This results in a mass saving of 3593.1 kg .
The total weight of fuel saved for the 7500 nm mission can be calculated using:
∆Wfo = ∆Wfo(∆Wa) + ∆Wfo(∆fp) + ∆Wfo(∆d)
which gives a weight saving of 40053 N (i.e. 4083 kg).
3.4 Validation of suction region design
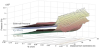
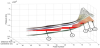
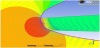
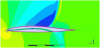
Computational Fluid Dynamics (CFD) software is applied to perform the numerical simulation as a process of validation of suction region design. Different models were run with the porosity of the porous section varied. An example of the typical results is shown in Figure 10 indicates the variation in velocity at the leading edge and Figure 11 shows the location of shock wave above the airfoil. From the results it can be found that there is a pressure drop across the front porous domain as expected. The analysis found that doubling the porosity of both regions would increase the amount of airflow by up to 40%. In addition it confirmed that sufficient suction levels to suppress attachment line transition could be achieved passively. Using the same CFD models, the pressure distribution across the airfoil was plotted and compared with the results when the simulation was run without suction. The results are shown in Figure 12 and contain close-up images of the inlet and exhaust regions; the pressures given are relative to the freestream pressure at cruise conditions. The main change is that at the exhaust, due to the amount of the exhaust airflow there is a reduction in pressure relative to the airfoil with no suction. It can also be seen that at the leading edge, due to the suction there is also a reduction of pressure at the suction region relative to the porosity of the suction surface and the areas outside of the suction region (from 0.2% chord) are at a slightly higher pressure as a result. The reduction of pressure at the inlet is very small compared to the reduction at the exhaust. This means that the overall pressure drop between the inlet and exhaust has increased by approximately 3500 Pa which will induce more suction than required and may result in VH exceeding the limit of 40 m/s.
This shows that the design of the passive suction surface must be an iterative process; the steps previously presented in would be the first iteration after which the inlet and exhaust pressures must be input back into the initial calculations to converge upon a suitable value of porosity. Alternatively, a control valve within the duct could be used to ensure that the maximum mass flow rate is not exceeded. Looking at a retrofit Hybrid Laminar Flow [13] which can be led to 6 to 7% net drag benefit at cruise, motivates and supports the advantage of this study where Hybrid Laminar flow control by suction could increase the payload by 12% or increase the aircraft range by 5% for the same payload. In the current study, the electrical turbocompressor is suggested where another solution would be the introduction of a purge system where the pressurized bleed air is taken from the engine compressor to act as both a de-ice and a de-insect device.
4. Conclusion
The final HLFC system design utilizes both active and passive suction and fulfils the requirement of improving the aircraft performance. The active suction suppresses the crossflow and Tollmein-Schlichting instabilities from just below the leading edge highlight to the front spar. The passive suction automatically sucks the attachment line boundary layer to delay the attachment line transition which is essential for the active suction to be as effective.
Overall, it is advantageous to incorporate the HLFC system into the aircraft because the over 3500 kg can be saved. This means that either the payload could be increased by 12% which makes the aircraft significantly more profitable. Alternatively, 3500 kg of extra fuel would increase the aircraft range by 5%. This makes the aircraft more marketable; particularly as more fuel efficient aircraft are becoming more of a priority as fuel prices continue to increase.
The anti-insect device consists of the Krueger flap which acts as a deflector, and an anti-insect spray mounted on the Krueger flap directed at the leading edge. The turbocompressors are electrically powered. A more ideal solution would be the introduction of a purge system where hot, pressurized bleed air is taken from the engine and blown out through the porous skin; this would act as both a deicing and a de-insect device. Furthermore, it would mean that the turbocompressors could also be powered by the compressed bleed air without additional pipes being required. For the purge function, the air powering the turbocompressors would be diverted using a value so that it flows directly into the ducts, therefore the turbocompressors would stop the suction and the high pressure airflow would blow out any insects lodged in the holes and melt any ice. In addition, any water from melted ice which goes inside the porous skin would be evaporated into the hot purge air and carried out through the skin so there is little chance of water reaching the turbocompressor and potentially reducing the service life.
Furthermore, with the current design only 50% of the overall suction area is used for suction, the other 50% is taken up by the wide stringers required for the anti-icing system; however with a more solid substructure the stringer thickness could be reduced so there is more suction area. This would mean that for there are more holes for the air to flow through which means that the requirement for VH to be less than 40 m/s would be easier to achieve allowing more flexibility in the porous surface design which may mean that each collector may not need to be split into as many sections and the part count could be reduced.
Regarding the maintainability of the HLFC system, the Krueger flap allows for direct access to a majority of the ducts including the pressure filters and collectors. The pressure filter slots are oriented so that there is easy access to each filter so that during scheduled maintenance they may be removed and checked for any damage or blockages.
Water ingested into the system may cause rusting or may block the pressure filters if it freezes. It is necessary to make sure that the turbocompressor can deal with a small amount of water in the air without degradation. When the aircraft is on the ground, hot pressurized air from the ground cart should be used as a purge function so that any water collected in the system can be evaporated into the hot air and blown out through the porous skin. This will also remove any dust or insects which may be lodged in the porous skin.
If this project is taken further it is advised that the purge system is being designed in more detail. The turbocompressors are located near the engines so bleed air can be ducted directly into the ducts to clear any dust or insects that may have clogged any holes in the porous skin (although careful design of the skin has minimized this likelihood). Any water in the ducts (either from rain, mist or melted ice) will be evaporated by the hot bleed air and will be exhausted out of the porous skin at the same time. The engine has been designed to be able to cope with the required amount of bleed air off take.
Relative to other aircraft systems, HLFC systems are fairly untested and the design in this article has been based wholly on the equations found through experimental data from various sources and then verified by a sort of CFD investigation. Less physical tests are done and no accessed information found from probable experimental work. This made the current work a genuine solution. It is recommended that before this system is employed on any aircraft, full scale experiments are undertaken which can confirm that the pressure drop through the skin is as expected and that the amount of suction that can theoretically be achieved can be also be achieved practically.