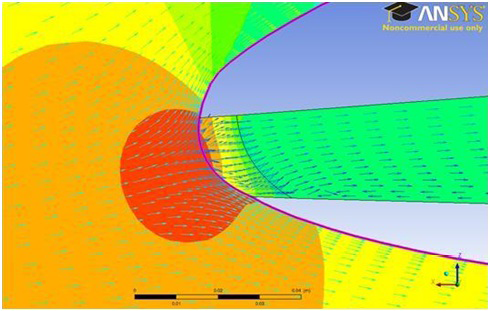
Figure 10:
Velocity vector contour at leading edge, red to blue shows higher to lower speed.