


1. Introduction
The information age has recently witnessed an unprecedented increase in digital media transfer. However, messages transferred over the Internet are vulnerable to illegal interception by a third party [15]. Therefore, researchers have developed data hiding techniques to embed secret messages in media to successfully transfer and protect confidential information. Data hiding has been widely used in many applications, including secret message sharing, image authentication, ownership assertion, tamper detection, and watermarking. This study focuses on secret message sharing.
Data hiding is divided into non-reversible data hiding (Non-RHD) and reversible data hiding (RDH), depending on whether a stegoimage can be restored to the original image. When a stego-image cannot be restored to the original image after the extraction of secret messages, it is known as a non-RHD technique. In contrast, an RDH technique can restore a stego-image to the original image, enabling the reuse of images. Therefore RDH techniques are often used in high-value images such as military maps, medical imaging, and works of art [11,16,17]. However, the reuse of images comes at the expense of embedding capacity. Therefore, a major focus of RDH research is how to improve the embedding capacity while maintaining image restorability.
The most commonly used RDH methods are the histogram-shifting technique, the difference expansion method, the dual-image-based method, and image-interpolation-based schemes. The histogramshift method, first proposed by Ni et al. in 2006, analyzes the pixel (or error value) distribution of an image to build a statistical histogram [9]. Then, the scheme shifts the pixel values, and embeds the secret bit into frequently occurring, or peak point values. A weakness of this method is its low-hiding capacity.
The difference expansion method embeds secret messages using the differences between pixels (or between the original and predicted pixels). For example, the difference expansion prototype, as proposed by Tian in 2003, doubles two adjacent pixels to embed one bit of secret message [13]. In 2004, Alatter extended Tian’s method by embedding three bits of secret messages in the doubled difference distance between four neighboring pixels [1]. In 2009, Lou et al. proposed a multilevel data hiding technique, which takes two horizontal pixels as an embedding unit, using a column-based strategy with an odd number of rounds, and two vertical pixels as the embedding unit, using a field- based strategy with an even number of rounds. Then, Tian’s method is employed for embedding when the difference distance declines after multiple embedding [8]. In 2012, Qin et al. proposed a method that embeds two bits of secret messages in a difference distance, calculated using the original pixels and the average of three adjacent pixels [12]. In 2013, Ou et al. doubled the error threshold, based on the length of the secret messages to be embedded and using the partial differential equation (PDE) as a predictor [10]. In 2013, Li et al. applied difference expansion to embedding secret message in color images, using Tian’s method after converting the color images into RGB color charts and then choosing a threshold-based prediction chart [6]. In 2014, Gui calculated the complexity of each pixel using a gradient-adjusted predictor (GAP), which was then used as a basis for difference expansion classification and secret message embedding [3]. In 2014, Lu et al. [7] proposed a reversible method based on difference expansion, histogram shifting and interpolation strategies to conceal secret data in the reference pixels for increasing the hiding payload. After that, Govind and Wilscy proposed a enhanced reversible hiding scheme based on directional interpolation and difference expansion. In their scheme interpolation method is used to get more accurate prediction value for reducing the prediction error and finding more embeddable number of pixels in 2015 [2].
The disadvantage of the difference expansion method is that if the difference distance is too large, the image quality will be severely degraded after expansion. Image quality damage after expansion is less for small difference distanced. Therefore, technical discussions of this technique focus on how to reduce the difference.
Another emerging RDH technique is image enlargement, which embeds secret messages while inserting fictional pixels into existing pixels. Examples of this method include that by Jung and Yoo in 2009, who proposed the neighbor mean interpolation (NMI) [4], Lee and Huang’s proposed interpolation by neighboring pixels (INP) in 2012 [5], and Tang and Song’s proposed high-capacity reversible steganography (CRS) in 2014 [14].
In contrast to difference expansion methods, the size of the stegoimage from image-enlargement-based hiding methods is larger than that from either difference-expansion-based hiding schemes or histogram-based methods. The sizes of stego-images produced by image enlargement methods are 1-2 times larger than the size of the original image. The secret messages must be extracted from the fictional pixels in the extraction phase, and then the image is reduced to obtain the original image. However, the stego-images produced by such methods are likely to have a jagged blur, and the embedding capacity is also low. Therefore, in this study we propose a reversible data hiding method to improve embedding capacity and image quality.
In this study, we examine the performance of the INP, NMI, and CRS image enlargement methods. According to our experimental results, the INP method proposed by Lee and Huang outperforms the other two. Hence, our proposed method applies INP image enlargement to calculate a virtual predictive value and then embeds a fixed secret message length to obtain the highest embedding capacity while yielding image qualities similar to those of other methods. We use a secret message reduction strategy, as proposed in our previous research [19], in which a secret message is preprocessed before embedding to reduce the image quality damage caused by large-value bits. Based on our experimental results in [19], this secret message reduction strategy can indeed improve image quality. In this paper, we advance this strategy and apply it to general and nature images. We describe the three image enlargement methods in section two. In section three, we describe our research process and provide examples. In section four, we discuss our experimental results. Finally, in section five we offer our analysis and conclusions.
2. Related Work
2.1 Neighbor Mean Interpolation (NMI)
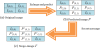
Neighbor mean interpolation (NMI), a data hiding method proposed by Jung and Yoo in 2009 [4], first produces a predictive image by enlarging an original image, and then embeds into it a secret messages to generate a stego-image. Once received, the receiver extracts the secret messages from the stego-image. Pixel enlargements are shown in Figure 1. Figure 1(a) shows the original pixels, which are then inserted with a predicted pixel pNMI into any two horizontal or vertical pixels of the four. Figure 1(b) shows the enlarged result. pNMI is calculated using NMI by taking the average value of the adjacent pixels as the virtual predictive value, as follows:
In Formula 1, m and n are the height and width of the original
image block, and i and j are the pixel positions. Taking Figure 2 as an
example, the original image is shown in Figure 2(a), where I(0,0)=229,
I(0,1)=232, I(1,0)=233, and I(1,1)=231. Assume that the secret message is s
= (10011)2. The virtual predictive values
Continuing with the example above:
Substitute the calculated value dNMI into Formula 3 to get
2.2 Interpolation by Neighboring Pixels (INP)
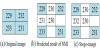
Interpolation by neighboring pixels (INP), proposed by Lee and Huang in 2012, also produces a predictive image first by enlarging an original image, and then embeds secret messages to obtain a stegoimage [5]. The virtual predictive value PINP is calculated using INP, which takes the average value of the original pixel I(0,0) and the average of the two adjacent pixels, as the virtual predictive value. The INP formula is as follows:
The example here uses the same original pixels as those in
section 2.1. Assume the reduced pixels are I(0,0) = 229, I(0,1) = 232,
I(1,0) = 233, and I(1,1) = 231. We calculate the virtual predictive values
Next, we select the maximum value, using Formula 5, from the four corners as the basis for subtracting the virtual predictive value. For example, if B = max(129,132,133,131) = 133, we subtract the virtual predictive value from the calculated value of B to get the difference, as follows:
Continuing with the above example,
Next, substitute the calculated value dINP into Formula 7 to get
2.3 High Capacity Reversible Steganography (CRS)
High-capacity reversible steganography (CRS), proposed by Tang and Song in 2014 [14], selects the maximum Imax and minimum Imin values from pixels at the four corners before calculating the virtual predictive value pCRS. The formula is as follows:
The reference value AD, calculated using the maximum Imax and minimum Imin, refers to the maximum and minimum pixels at the four corners, so the calculated virtual predictive value is more accurate. The formula for calculating AD is as follows:
Next, we use the values from the same example used in Formulas 8 and 9 to get Imax = max{229,232,233,231} = 233, Imin = min{229,232,233,231} = 229, and AD = (3×229+233)/4 = 230. The average of the calculated reference value AD and the average of the two adjacent pixels is, PCRS calculated as follows:
Continuing with the above example, and using Formula 10,
Entering these values into Formula 11, we obtain
3. Proposed Scheme
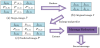
In this study, for image enlargement and prediction, we employ the embedding rules of the INP prediction method described in section 2.3, whereby secret messages are hidden between virtual predictive values P(i,j). The reasons we chose to use INP for image expansion are shown in Figure 5 and Table 1.
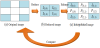
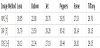
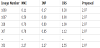
The diagram in Figure 5 demonstrates our comparison of the interpolated and original images. The proposed scheme reduces a 256 × 256-pixel original image to a 128 × 128-pixel reduced image, which is then used to produce an enlarged interpolated image using the NMI, INP, and CRS techniques. Then, we compared the image qualities of the three interpolated images and the original image. Table 1 shows that Lee and Huang’s virtual predictive value yielded a higher accuracy and PSNR value. Therefore, we employed the INP technique to enlarge the original image in this study.
Figure 6 is a diagram of the embedding procedure we used. First, the original image is enlarged using INP. Next, the secret message is folded using the proposed message reduction strategy. The folded message is then embedded into the interpolated image to generate a stego-image. The embedding process is described in detail in section 3.1 below.
3.1 Embedding process
To enhance the security of the proposed scheme, a cryptography algorithm can be used first to encrypt the secret message. After being encrypted, the secret message is folded using the proposed message reduction strategy to conceal the interpolated image.
The virtual predictive value P(i,j), as described in section 2.2, is calculated using two adjacent pixels. A 4-bit fixed-length secret message s is embedded into each virtual predictive value. The secret message is transformed into a decimal number b. The secret symbol b, from 0 to 15, is obtained after converting the secret message into a decimal number. In this study, we set four bits of a secret message to be hidden in each predicted value, so the secret symbol value range was [0, 15]. If a secret symbol is embedded directly into a predicted value, it can cause large stego-pixel distortion. Therefore, we first changed the secret symbols to positive and negative values by subtracting eight, the intermediate value of the range, from the secret messages. In this way, the range of positive numbers changed to [-8, 7]. The reduction formula is as follows:
b'=b-8
For example, if we suppose the secret message is b = 3, we subtract from it the intermediate value eight to obtain b' = 3 - 8 = -5 which is the reduced secret message. The proposed scheme replaces b with b' to embed it into the predicted value. We then add the reduced secret message b' and the predicted values to get stego-pixel P', as follows:
P'(i,j) = P(i,j) + b'
When the predicted value is less than (or equal to) 7, however, the possibility that the reduced secret message may be equal to b' = −8 will result in stego-pixel p' being less than 0, therefore causing an underflow problem. Also, when the predicted value is greater than (or equal to) 249 and b' = 7, the stego-pixel p' = 249 + 7 = 256 will cause an overflow problem. Therefore, if the predicted value is less than (or equal to) 7 or greater than (or equal to) 248, extra judgment is required. If the predicted value P(i,j) is less than (or equal to) 7 or greater than (equal to) 248, the secret message will not be reduced, and we amend Formula 12 as follows:
Formula 13, used to produce a stego-pixel, must also be slightly amended as follows:
When the predicted value is greater than (or equal to) 249, messages must not be hidden by addition as this may cause overflow. Instead, subtraction is used for message embedding.
The pseudo code of the embedding procedure for each embedding pixel is shown below:
Input: Predictive value P(i,j), secret message s
Output: Stego pixel P'(i,j)
Step 1: Transform the secret message s into a decimal secret symbol b
Step 2: If P(i,j) <= 7 or P(i,j) >= 249) then b is reduced by using reduction strategy where b'= b -8. Otherwise, b' = b.
Step 3: Embed the reduced symbol b' into P(i,j). If (P(i,j) >= 249) then P'(i,j) = P(i,j) - b', otherwise, P(i,j) = P(i,j) + b'.
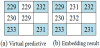
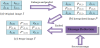
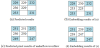
The embedding order begins with the first virtual predictive value and ends with the last virtual predictive value. For example, in Figure 7(a), the virtual predictive values P(0,1) = 129, P(1,0) = 130, and P(1,1) = 129 are first calculated using INP, and the secret message s = (100110110101)2 is assumed. Four bits of secret message are embedded into each virtual predictive value, s1 = (1001)2, and are then converted into a secret symbol to get b1 = (9)10. As such, the predicted value P(0,1) is neither less than (or equal to) 7 nor more than (or equal to) 249. We use the reduction formula to then get b' = 9-8 = 1. Next, Formula 15 is used to obtain: P'(0,1) = 229 + 1 = 230. In this way, secret messages are embedded in all the virtual predictive values, as shown in Figure 7(b).
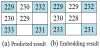
The pixels that may cause underflow/overflow are shown in Figure 7(c). Their predicted values are P(0,1) = 251, P(1,0) = 250, and P(1,1) = 250. If we assume that the secret message is s = (110010110011)2, then s1 = (1100)2, we can convert it into a secret symbol to get b1 = (12)10. The predicted value P(0,1) is greater than 249, so we do not reduce b1, and b'1 = b1 = 12. Using Formula 15, we obtain: P'(0,1) = 251–12 = 239, and continue the calculation in this way. The embedding results are shown in Figure 7(d).
3.2 Extraction and restoration processes
After receiving stego-image I', the receiver first reduces and restores it to the reduced image, and then uses INP to enlarge the image to obtain the virtual predictive value. Next, the receiver subtracts the virtual predictive value from the stego-pixel to get the embedded message b', as follows:
b' = P'(i,j) - P(i,j)
If the predicted value is less than (or equal to) 7 or greater than (or equal to) 249, b' is the original secret symbol. Otherwise, we add the intermediate value 8 to b' to restore secret symbol b. The formula is as follows:
Next, we convert b into a binary bit to extract the embedded secret messages, as shown in the flow chart in Figure 8. For example, in Figure 7, after receiving a stego-image, the receiver first reduces and then enlarges this image to obtain the virtual predictive values, P(0,1) = 229, P(1,0) = 230, and P(1,1) = 229. Then, the predicted value is subtracted from P' to extract the secret message b'1= P'(0,1)- P(0,1)=230-229=1, and 8 is added to b'1 to get b = 1 + 8 = 9, which is (1001)2 in binary. All secret messages are extracted in this way.
The extraction process from the pixels, after underflow/overflow processing, is the same, as shown in Figure 7(c). First, the predicted value is calculated to get P(0,1) = 251, P(1,0) = 250, and P(1,1) = 250, and then the predicted value is subtracted from the stego-pixel to get b'1= |239-251|=12. Since the predicted value P(0,1) is greater than 249, b1 is b'1, and b1 = b'1 = 12, which is (1100)2 in binary. The procedure continues in this way to extract the original secret message. The pseudo code of the extraction procedure for each stego pixel is shown below:
Input: Stego pixel P'(i,j) and predictive pixel P(i,j)
Output: secret message s
Step 1: Subtract P(i,j) from P'(i,j) to get embedded message b', where b'=P'(i,j)-P(i,j)
Step 2: Get the secret symbol b. If P(i,j)≤7 or P(i,j)≥249 then b = b'. Otherwise, b=b'+8.
Step 3: Convert b into a binary bit to extract the embedded secret messages s.
4. Experimental Results and Discussion
We experimentally compared the method proposed in this paper with the NMI method proposed by Jung et al., the INP method proposed by Lee and Huang, and the CRS method proposed by Tang et al. In the experiments, we used six grayscale 256 × 256-pixel images for testing, as shown in Figure 9. After enlargement, the size of the test image was 512 × 512. We used MATLAB R2012a for the system development environment. Measurements were made using peak signal-to-noise ratio (PSNR), calculated as follows:
where m×n is the image size. All the experimental images were 8-bit 256-color grayscale images. The greater the difference between the stego-pixel and the interpolated pixel, the higher the degree of image distortion and the lower the calculated PSNR. The smaller the difference, the lower the degree of distortion and the higher the PSNR.
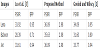
In the experiments, we generated the secret message using a MATLAB random number generator (RNG). Table 2 shows the comparison results of the proposed and other three methods for the PSNRs and bits per pixel (bpp) of the stego- and interpolated images. We see that, except for being 1 db less than those of the NMI and INP methods for the Tiffany image, the PSNR of the proposed method is more than 2 db better than the other methods on all the other images, and may even be 5 db better on complex images such as the Baboon. Although the PSNR of the proposed scheme is less than that of other methods in some areas, the hiding capacity of the proposed scheme is more than 1.61 bpp higher than the others.
Whether the images are smooth or complex, the proposed method can embed 4-bit fixed-length secret messages. For an enlarged 512 × 512 image, the total number of embedded pixels is (512×512−256×256) = 196,608. Figure 10 shows a diagram of the embedding position. Cells marked +4 indicate that the pixel can be embedded with four pixels. As each predicted pixel can hide 4 bits, the maximum embedding capacity is 196,608 × 4 = 786,432 bits. The maximum bpp is 3786,432/ (512×512) bpp, or up to 2.98 bpp, excluding the edge pixels, which cannot be embedded. As we can see in Table 2, the fixed embedding capacity of the proposed method is 2.98 bpp, which is more than 1 bpp better than that of the other methods.
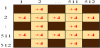
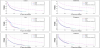
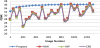
Figure 11 shows comparisons of the embedding capacities and PSNRs of the proposed and other three methods. Under the same embedding capacity, the total embedding capacity of the proposed method is approximately 1.5 bpp higher than that of the other methods and it maintains a stego-image quality above 30 dB.
Furthermore, the proposed scheme also compare the experimental results with two latest RDH schemes [2,7]. Table 3 shows the comparison results. The image qualities and the hiding capacities of the proposed scheme are higher than that of the other two methods.
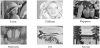
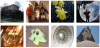
To prove that the proposed method is not only effective for specific images, we tested it on 1,338 images from the Uncompressed Colour Image Database (UCID) [18] (http://homepages.lboro.ac.uk/~cogs/datasets/ucid/ucid.html). All the UCID images are color images, sowere first converted into grayscale images for this test. Examples are shown in Figure 12.
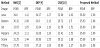
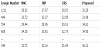
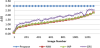
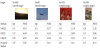
To facilitate comparison, we sorted the experiment results according to the PSNR and bpp values of the proposed scheme. For example, Tables 4 and 5 show some experimental results for the proposed scheme and the other methods. Both tables are sorted by the PSNR and bpp value of the proposed scheme, in increasing order. In Table 4, the PSNR value using NMI on image number No. 1211 is 28.02 dB, that of INP is 27.67 dB, and that of the proposed scheme is 32.26 dB. The proposed scheme outperformed all the other methods. In Table 5, the hiding capacity using NMI on image number No. 1060 is 0.11 bpp, that of INP is 0.17 bpp, and that of the proposed scheme is 2.97 bpp.
The overall results are shown in Figures 13 and 14. We see in Figure 13 that the PSNRs for about 80% of the images by the proposed method are better than those of the other methods, and the stego-image quality of about 20% of the images is worse than in the other methods. A careful analysis of these 20% shows that most are very smooth images such as image Nos. 1060 and 603 in Table 5. The proposed method has an embedding capacity of 2.97 bpp regardless of whether the image is complex or smooth, while the other methods embed fewer messages in smooth areas. As such, the proposed method has a higher degree of distortion compared with the other methods.
From Table 5, we see that the fixed embedding capacity of the proposed method is 2.97 bpp, which is better than that of the other methods. We also see that the other methods are better than the proposed method for two images, Nos. 1030 and 1046 in Table 6, which are complex. The other methods have an embedding capacity of over 3 bpp, but their stego-image quality drops significantly. While the embedding capacity of the proposed method is about 1–2 bpp lower, the PSNR is over 14 db higher.
Therefore, the proposed method obtains good results regardless of whether the images are smooth or complex.
5. Conclusion
In this study, we proposed a RDH method based on INP image enlargement to shrink secret messages using a reduction strategy that reduces the damage caused by the enlargement process. The proposed method obtains good results regardless of whether the images are smooth or complex that is because the proposed scheme applied the secret message reduction strategy. The value range of the secret message was changed from [0, 15] to [-8, 7] by using secret message reduction strategy. The max distortion between the secret pixel and the original pixel is from (max(|0|, |15|))2 = 225 reduced to (max(|7|, |-8|))2 = 64. Hence, the secret message reduction strategy can effectively reduce the image distortion and improve the image quality. To avoid underflow/overflow problems, the proposed method utilizes the concept of the same predicted value to process underflow/ overflow pixels in different embedding directions. The receiver can obtain the same predicted value, and can therefore retrieve the correct information in the opposite direction. Experimental results show that the embedding capacity of the proposed method is greater than that of the other methods when the image quality is similar. Our results also show that a 4-bit fixed-length secret message can be embedded regardless of whether an image is complex or smooth. Since the underflow/overflow problem is taken into account during the embedding process, there is no need for any additional recording of the underflow/overflow pixels. The more accurate the virtual predictive value, the better the image quality will be.
Competing Interests
The author declare that he has no competing interests.