


1. Introduction
Branched-chain amino acids (BCAAs), that are isoleucine (Ile), leucine (Leu) and valine (Val), are proteinogenic essential amino acids carrying an aliphatic-branched side chain. BCAAs not only play a pivotal role as key building blocks for peptide synthesis, but are recognized to be also important sources for the biosynthesis of sterols, ketone bodies and glucose. It has been estimated that the BCAAs pool accounts for about 21% of the total body protein content, while free BCAAs constitute an extremely minor proportion (272 to 556- fold less) of the total mass of BCAAs in the body [1]. In spite of this paucity, free BCAAs act however as important nutrient signals and metabolic regulators [2].
Mounting evidences clearly demonstrate that BCAAs are associated with several pathological states, including obesity [3], insulin resistance [4-7], type 2 diabetes mellitus (T2DM) [6,8], cancer [9], cardiovascular [10] and liver diseases [11], chronic kidney disease (CKD) [12] and ischemic stroke [13]. Nonetheless, altered levels of BCAAs have been also found in patients with either major depression or Huntington Disease (HD)[14].
This body of evidence readily suggests the potential use of BCAAs as biomarkers of disease in clinical practice. Interestingly, it has been also demonstrated that, circulating levels of BCAAs could be valuable prognostic tools and predict populations, at risk for various pathological conditions, encompassing cardiometabolic disease [15] and T2DM [16].
For some pathology, the underlying biochemical mechanisms accounting for the altered levels of BCAAs is still unclear or rather speculative.
Some of these issues will be touched in the following sections.
2. Obesity, Type 2 Diabetes Mellitus and Cancer
In the last decades, obesity has become a global public problem indistinctly diffused in both developed and developing countries [17,18]. The increasing number of obese people in industrialized countries is intimately related to various aspects of modern lifestyle, including inadequate nutrition and leisure time activities. The strong association of obesity with T2DM [19], hypertension [20], and metabolic syndrome [21], highlights the urgent need to monitor its persistence in adults and to investigate its possible pathological developments.
During the last decade, many scientific studies have repeatedly described increased plasma levels of BCAAs in overweight and obese adults and children [22]. Very interestingly from a diagnostic point of view, elevated levels of BCAAs have often been demonstrated to presage the development of T2DM well in advance of its actual occurrence. Thus, their quantification in plasma could be a useful indication of the occurrence of metabolic derangements on route to diabetes [6,23,24]. A large number of studies shows a strong correlation between circulating BCAAs levels and insulin sensitivity. Stronger effects have been observed in men, with evident age- and ethnicity-related variations. Many evidences coming from in-vitro and in-vivo studies have indisputably demonstrated that BCAAs may contribute to the development T2DM as well [7,16,25].
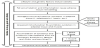
Impaired mitochondrial oxidation is thought to be the major cause for increases in BCAAs levels, independent of established insulin resistance. In obese individuals, the adipose tissue is characterized by an accumulation of fat, an increased proinflammatory state, and alterations in hormone and cytokine secretion. All of these factors can strongly affect the mitochondrial function in peripheral tissues. Indeed, incomplete oxidation of BCAAs results in the accumulation of toxic intermediates, such as branched-chain keto acids and branched-chain fatty acids, which interfere with insulin signalling and can induce insulin resistance. Impaired insulin signalling in muscle causes an increased proteolysis, leading to a further release of BCAAs in the circulation and a further supply of substrates for mitochondrial oxidation. This issue may be further complicated in case of highprotein diets. A proposed aetiology of increased BCAAs levels in insulin resistance and T2DM is shown in Figure 1 [16].
A growing body of epidemiological studies has indicated that obese and diabetic individuals have a higher risk of getting some types cancer than lean, healthy people [26,27]. Pancreas and liver cancer as well as endometrial, breast, colorectal, bladder and kidney cancers are among the types of cancers mostly associated with T2DM [28]. It is well known that amino acid levels are distinctly perturbed in obese and diabetic subjects [3,29,30]. Many types of cancer accompany with a sensitive alteration in amino acid metabolism due to the demands of the tumour and its interaction with the host [31,32]. These perturbations are particularly evident for the group of BCAAs [6,8,33-38], whose significant alterations are found in the presence of cachectic wasting disorder [39,40]. Cachexia is a disorder characterized by the massive loss of both adipose and skeletal muscle tissue and represents one of the most devastating sequela of many types of cancers. The progression of cachexia appears to involve a net increase in protein catabolism along with an activation of proteolysis and a significant reduction in protein synthesis.
In a healthy state, BCAA oxidation in skeletal muscle provides around 10% of the energy needs. Instead, under a pathological state, that is, under highly catabolic circumstances, BCAA oxidation can contribute up to 20% [41]. Myofibrillar proteins are composed of approximately 20% BCAAs and therefore, breakdown of skeletal muscle can produce a noticeable increase in BCAAs [40].
A number of studies have noted widespread decreases in circulating amino acids in cachectic patients, with the most profound decreases being experienced by BCAAs [42,43].
Based on the above assumptions, it might be expected that the increased proteolysis would lead to an increase in the circulating BCAAs. Instead, this increase turns into an amplification of the oxidative pathway. Moreover, the tumour itself uses the catabolized BCAAs for the protein synthesis process. Both events justify the decrease of circulating BCAAs in cachectic patients.
It should be pointed out that the balance of catabolism, oxidation and protein synthesis may be quite different for different tumours and, therefore, the use of BCAAs as biomarkers of tumours could lead to erroneous conclusions without a greater metabolic and phenotypic profile.
Besides reducing the quality of life, cachexia often limits the efficacy of many chemotherapeutic interventions. Therefore, a rational way of monitoring the BCAAs levels in cancer patients may be of aid to improve the effect of pharmacological treatment with a selective supplementation of BCAAs [44].
3. Liver Diseases
Serum concentrations of BCAAs have been found to decrease in patients with advanced liver diseases. An opposite situation has been instead observed for the aromatic amino acids (AAAs) phenylalanine (Phe) and tyrosine (Tyr). This in turn results in a lower concentration ratio of BCAAs to AAAs, a ratio called the ‘Fischer ratio’ [45,46], in comparison to patients with healthy liver conditions. The imbalance of amino acids becomes more pronounced with the progression of the liver pathology, and aminograms have demonstrated to be valuable prognostic toolsfor liver cirrhosis in patients with or without hepatocellular carcinoma [47,48].
The amino acid metabolism in patients with hepatitis B virus HBV infection is markedly perturbed.
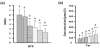
In the frame of a broad study, Yang and co-workers [49] measured increased peripheral blood plasma concentrations of Tyr and decreased concentrations BCAAs in HBV positive patients. As a consequence, the BCAAs to Tyr ratio (an index currently indicated as BTR) resulted significantly lower in patients with HBV infection compared to healthy donors (i.e. the control group). Very interestingly, BTR correlated well with the severity of the various clinical types of HBV infection (Figure 2) [50,51]. Indeed, colorimetric determinations indicated that, when compared with the control group, the concentration of Tyr from patients with HBV infection showed significant differences decrease (p<0.05 or 0.01) (Figure 2a).
A significant decrease(p<0.05 or 0.01) was recorded when the BTR values from patients with various clinical stages of HBV infection namely, acute hepatitis B (AHB), moderate chronic hepatitis B (CHB-m), heavy chronic hepatitis B (CHB-h), liver cirrhosis (LC), and severe chronic hepatitis B (CHB-s) were compared with those of the healthy donor group (Figure 2b).
Based on these experimental outcomes, even though still not well explained from a biochemical standpoint, the measurement and monitoring of plasma levels of BCAAs and Try, could be fruitfully used for the typing and staging of HBV diagnosis. Furthermore, BTR value could help to evaluate the nutritional status of HBV patients, and to gain a better understanding of pathological changes in the liver.
4. Chronic Kidney Disease
The nutritional status of CKD patients is a predictor of prognosis during the first period of dialysis. Uremic malnutrition is highly diffused among CKD patients, and significantly affects the morbidity and mortality rate observed in this patient population. Plasma levels of BCAAs (especially Val and Leu) were found to be in strict correlation with nutritional status.
Patients with CKD usually show anomalies in terms of plasma AAs. However, the mechanisms behind these abnormalities are still rather unclear. It is widely accepted that inadequate nutritional intake and malnutrition contribute to plasma AA abnormalities.
Biochemical alterations occurring in the context of inflammation lead to an increase in the AA metabolism. Indeed, inflammation commonly effecting CKD patients has been shown to reduce their plasma amino acid concentrations [52,53].
The systemic inflammatory response enforces protein catabolism [54,55], while the release of AAs from muscle protein provides a substrate for the synthesis of acute phase proteins and proteins of the immune system [56]. This in turn results into a general decrease in plasma AA levels and, in particular, of BCAAs.
Plasma BCAAs concentrations were measured by Kumar and coworkers in 15 patients of early stages of CKD and 15 healthy controls. The quantitative estimation was carried out by using a reversedphase high-performance liquid chromatography (RP-HPLC) system after pre-column derivatization with the O-phthalaldehydemercaptoethanol- based system [12,57]. A significant decrease in Val and Leu concentration was observed in CKD patients when compared with the controls (p<0.05).
5. Muscle Mass and Knee Osteoarthritis
Identification of biochemical mechanisms associated to the maintenance of muscle and fat-free mass in older adults is of great importance for addressing the rising challenge that health care is already facing with physical disablement in the growing aging population. With this aim, Lustgarten and co-workers [58] identified serum metabolites displaying significant associations with thigh muscle cross-sectional area (CSA) and fat-free mass index (FFMI), with particular regard to functionally limited older adults. As a result of the HPLC-MS study, BCAAs were found to be significantly associated with both thigh muscle CSA and the FFMI.
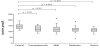
A targeted matabolomic study was carried out by Zhai and coworkers in response tothe urgent need to identify and develop valuable biochemical markers useful for characterising the status, prognosis and measures of treatment response in knee osteoarthritis [59]. In all white unrelated women with the pathology, knee osteoarthritis was defined as either radiographic, physician-diagnosed clinical osteoarthritis, or total knee joint replacement due to primary osteoarthritis.
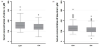
The healthy controls were defined as having none of these. The study performed with a QTRAP-LC-MS/MS system highlighted a statistically significant association between the serum ratiosof Val to histidine (His) and the sum of Leu and Ile (here called xleucine) to His and knee osteoarthritis; p-values resulted respectively equal to 1.6x10⁻¹⁰ and 8.2x10⁻¹⁰. Based on these results, the ratio of the BCAAs to His has potential in clinical use as osteoarthritis biomarker. Also interestingly, the absolute concentration of Val (Figure 3a) and xleucine (Figure 3b) themselves were significantly increased in knee osteoarthritis cases compared with controls.
5.1 Ischemic stroke
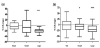
With the aim of establishing a metabolomic profile of ischemic stroke, Kimberly and co-workers first examined serial blood samples after filament occlusion in a rat model. Twenty animals were included in the analysis: 7 sham-operated animals, 6 animals with small infarction (stroke volume 9±5%), and 7 animals with large infarction (stroke volume 29±5%). By using a LC-MS/MS system, the authors revealed a significant decrease in the concentration of BCAAs in the large stroke group (p values equal to 0.003, 0.01, and 0.04, respectively) from baseline to 2 hours after stroke. Being BCAAs coordinately regulated, their levels change in conjunction with each other [13,60]. Therefore, a composite measurement of the BCAAs levels was considered which showed a 16±6% decrease in large stroke (p=1×10⁻⁵) and a nonsignificant trend in small stroke (Figure 4a).
The same evaluation was done on cerebrospinal fluid (CSF) samples. Also in this case, a composite of BCAAs demonstrated a decrease of 23±9% compared with sham CSF (n=5 for each group; p<0.005). The authors also evaluated the levels of BCAAs in human patients differently classifiable according to the National Institute of Health Stroke Scale (NIHSS). The set of individuals comprised a control group (patients with a diagnosis of transient ischemic attack or absence of stroke), a group with mild stroke (patients with a NIHSS 4-5), and a severe stroke group (NIHSS 15-19). Also in this case, all the three BCAAs were found to decreased in stroke compared with control patients, and to a greater extent in large compared with small stroke (p<0.01 for each). The composite BCAAs score demonstrated a 9±17% decrease in small stroke (p=0.03) and a 17±23% decrease in large stroke (p=1.1×10⁻⁵) (Figure 4b).
Among the proposed explanations for the reduction of BCAAs levels in blood or CSF, the triggering of a specific metabolic pathway leading to their consumption or sequestration in a different tissue compartment, is worth to be cited.
6. Major Depression and Huntington Disease
The proteinogenic BCAAs were found to play a role in the development of depression through the activation of the mammalian target of rapamycin (mTor) pathway. Accordingly, the results of a recent study authored by Baranyi and co-workers [61] has strongly evidenced that in patients with major depression, BCAAs might be appropriate biomarkers for the pathology. mTor is dysregulated during depressive episodes, and ketamine-induced activation of mTor is associated with a short-term decrease of depressive symptoms in patients suffering from major depression [61,62]. The study was performed on plasma samples from 119 participants: 71 suffering from major depression while 48 were physically and mentally healthy and without a former history of psychiatric disorders. The BCAAs levels were chromatographically measured in a RP-LC system after derivatization with o-phtalaldehyde. The BCAAs pool was found to be significantly decreased in patients with major depression in comparison with healthy subjects. The decrease of BCAAs in depressive patients observed in the study could be explained on the basis of a dysregulation of the mTor pathway due to BCAA deficiency during depressive episodes.
In the frame of a study aimed at evaluating the actual utility of BCAAs as biomarkers in Huntington Diseases (HD), Mochel and coworkers [63] measured fasting levels of plasma BCAAs as previously described in 16 presymptomatic HD gene carriers and 70 patients with HD at a mild, moderate, or severe stage of the disease. Instead, the control group was composed of 21 healthy individuals. Plasma levels of BCAAs were significantly lower in the HD group compared with controls. Among the three BCAAs, Leu was of particular interest because it was significantly reduced in patients at an early stage of the disease and, more remarkably, in presymptomatic individuals (Figure 5). Leu is a well-known activator of the mTor pathway [64] which regulates protein synthesis and when inhibited leads to an increased autophagic proteolysis [65]. Protein kinase B (PBK), also known as Akt, has been shown to be altered in HD rat brain and in peripheral blood cells of patients with HD [66], and found to mediate the activity of mTor. Therefore, reduced Leu levels and altered Akt activation in HD may both result in mTor inhibition and exacerbation of proteolysis in HD [67].
7. Conclusions
Recent evidences demonstrate that BCAAs are associated with insulin resistance, type 2 diabetes, chronic kidney disease as well as ischemic stroke, major depression and Huntington disease. Circulating levels of BCAAs have been also demonstrated having the potential to predict populations at risk for several pathologies. Therefore, the measurement and monitoring of plasma amino acid profiles represents as a promising alternative method to aid in the clinical diagnosis, and prognosis assessment for patients.
Although the use of BCAAs pool as a biomarker in the clinical setting has great potential, many questions can be raised regarding the mechanisms at the basis of the relationship between BCAAs levels and disease process/severity. Therefore, the concrete utility for BCAAs levels in diagnosing, predicting or monitoring disease strictly depends on the presence of additional information that will place these levels in the context of the entire phenotypic condition.
Competing Interests
The authors declare that they have no competing interests.