


1. Introduction
Drug discovery is a long-lasting process that must demonstrate that the drug addresses a specific disease and that safety and efficacy are ensured in humans. At the preclinical stage of drug discovery, researchers tend to use cytochrome P450 enzymes (CYP450s) for metabolic evaluation in animals, animal, or human liver microsome (HLM). This research method has been applied wildly and been shown efficiently, but there are still some problems that worth further consideration. Since liver microsomes cover all kinds of CYP450s, it is difficult to distinguish which CYP subtypes are responsible for the metabolism of the candidate compound. To identify the exact metabolic pathway of the candidate drug, the mixed CYP450 enzyme system is no longer reliable, and a new separated enzyme system needs to be considered. Secondly, the high cost and scarcity of HLM make it difficult to meet the needs for in vitro screening of a large number of drug candidates, thus limiting the efficiency of drug approval. Finally, the increase in the number of new drugs increases the need for drugdrug interaction (DDI) research to assure the safety of clinical therapy. Taking the DDI study into the evaluation system as a supplement to drug safety confirmation is an essential part of recent research work. On the whole, we need to establish a reliable, convenient, and economical system for high-throughput drug metabolism pathway screening that can be used for both the effective metabolic evaluation of new drugs or candidate drugs and screening for DDI. In this study, we adopted the recombinant human CYP450s yeast system that is developed by introducing human CYP450s genes into yeast cells to efficiently express a single subtype of CYP450s. It can be prepared in large amounts in a short time with high metabolic activity and low cost [1]. Compared to other in vitro models, the recombinant human CYP450s yeast system is more feasible for drug metabolism screening, DDI research, and preparation of potential metabolites.
Cytochrome P450 (CYP) 2C8, a member of the CYP2C subfamily, represents approximately 6-7% of the total CYP450s in humans [2]. It involves the metabolism of more than 100 commonly prescribed drugs, such as lipid-lowering drugs, anticancer agents, antimalarial agents, antidiabetic agents, and the number keeps increasing. It has been reported that the relative contribution of CYP2C8 in the formation of desethylamodiaquine (DEAQ) from amodiaquine (AQ) is almost 100%, indicating that AQ is a specific and excellent probe substrate for CYP2C8 [3]. Also, AQ is one of the substrates recommended for CYP2C8 research in vitro by the US FDA [4]. The withdraw of cerivastatin due to its DDI with gemfibrozil brought attention to the importance of CYP2C8 in drug metabolism [5]. Since then, it has been reported that after screening 209 commonly used drugs, 48 of them showed an inhibitory effect on CYP2C8 at 30 μmol/L in vitro [6]. Moreover, it has been demonstrated that various natural compounds show an inhibitory effect on CYP2C8 in vitro. For example, in vitro studies of cranberry powder and saw palmetto inferred that the inhibitory effect of both on CYP2C8 might have clinical significance [7].
Gingerol Soft Capsule (GSC) has been used in China for the treatment of rheumatic arthritis, rheumatoid arthritis (RA), gouty arthritis, osteoarthritis (OA), myotenositis and scapulohumeral periarthritis, due to its anti-inflammatory and analgesic effects, and the ability to regulate the immune system. The main ingredients of GSC are extracts of ginger (the root of Zingiber officinale Rosc.) and included 6-gingerol, 8-gingerol, 10-gingerol, 6-shogaol, 8-shogaol, 10-shogaol, 6-paradol, and curcumin [8]. The prevalence of RA in China was reported to be 0.2% [9]. The use of GSC in the treatment of RA may have a potential risk of DDIs because other common drugs used in the treatment of RA (e.g., ibuprofen) are also metabolized by CYP2C8 [10]. Firstly, the most common comorbidity of RA is depression, whose prevalence is 15-29% [11,12]. Amitriptyline is often used for treating depression and is also one of the substrates of CYP2C8 [13]. Apart from depression, since RA and diabetes share the same pathological process, RA patients also face higher risks of diabetes [14]. Pioglitazone, rosiglitazone, and repaglinide are commonly used to treat diabetes and are mainly metabolized by CYP2C8 [15-17]. Finally, due to a 50% increase in the risk of death from cardiovascular disease in patients with RA, statins (substrates of CYP2C8) are often added to the treatment regimen setting up potential DDIs [18].Therefore, RA patients using GSC would have the potentiality of developing DDI with CYP2C8 substrates.
Our study aimed to establish an efficient metabolite screening and DDI system using RHCYP2C8 yeast with AQ and to evaluate the inhibition potency of GSC on CYP2C8 in vitro.
2. Materials and Methods
2.1 Chemical and reagents
AQ and quercetin were obtained from Wuhan Yuan Cheng Technology Co., Ltd. Nanjing BRT-Biomed Co., Ltd provided DEAQ and recombinant human CYP2C8 yeast (RHCYP2C8). Gingerol Soft Capsule was obtained from Guizhou Bailing Group Pharmaceutical Co., Ltd. 6-gingerol was purchased from Nanjing Dilger Medical Technology Co., Ltd. Dipotassium hydrogen phosphate and potassium dihydrogen phosphate were from Xilong Scientific., Ltd. The NADPH regeneration system was purchased from iPhase Biosciences Co., Ltd. Lowry Protein Assay Kit was obtained from Beijing Solarbio Science & Technology Co., Ltd. Methanol was from Merck Drugs & Biotechnology (chromatographic grade). Dimethyl sulfoxide (DMSO) was obtained from Sinopharm Chemical Reagent Co., Ltd, and all other chemicals and reagents were of the highest grade available.
2.2 Preparation of stock solutions
10 mg AQ and DEAQ were dissolved in 10 mL water to prepare a standard stock solution of 1 mg/mL. The stock solution of 10 mmol/L was prepared in water for the reaction. Quercetin, 6G, and GSC contents were dissolved in DMSO to prepare stock solutions of 50, 6400 mmol/L, and 1200 mg/mL for DDI research. These stock solutions were diluted again with the same diluent for the preparation of solutions with different concentrations. All stock solutions were stored at a temperature of 4°C until use.
2.3 Preparation of SD-His medium
1 L SD-His medium contained Yeast Nitrogen Base W/O Amino acids 6.7 g, L-Histidine 0.02 g, D-(+)-glucose 20 g, and agar powder 20 g (added when preparing solid medium). The mixture was sterilized at 115 °C for 30 min before using. D-(+)-Glucose was prepared with a 20% solution and sterilized separately.
2.4 Preparation of YPD medium
1 L YPD medium contained Yeast Extract 10 g, Tryptone 20 g, and D-(+)-glucose 20 g. The mixture was sterilized at 115°C for 30 min before using. D-(+)-Glucose was prepared with a 20% solution and sterilized separately.
2.5 Preparation of RHCYP2C8 yeast whole-cell solution
The RHCYP2C8 yeast preserved in glycerol was inoculated on SD-His solid medium and placed in an incubator for 5 days (30°C). Afterwards, 16 single colonies (diameter ≥ 2 mm) were taken and transferred to a 500 mL triangular flask containing 200 mL SD-His liquid medium, and cultured for 40-48 h (30°C, 200 r/min). After 40-48 h, all the culture medium was transferred to a 2 L triangular culture flask, where 1400 mL of YPD medium was added, and then cultivated for 2 days (30°C, 200 r/min). Then, the SD-His medium was centrifugated and added according to the ratio of bacterial weight to medium volume 1:1. The RHCYP2C8 whole-cell stock solution was stored at 4°C until use. The RHCYP2C8 yeast was recovered for 2 days by adding SD-His liquid medium based on the ratio of bacterial weight to medium volume 1:20 and transferred to a 200mL triangular culture bottle in a constant temperature shaker at 30°C, 200 r/min. Subsequently, the RHCYP2C8 yeast suspension was centrifuged (3600 r/min, 10 min), and the precipitate was reconstituted with potassium phosphate buffer (pH 7.4) by the ratio of weight to medium volume 1:1 to get whole-cell solution for reaction use.
2.7 Preparation of RHCYP2C8 microsomes
The glass bead crushing method and differential centrifugation were used to extract yeast microsomes, with the ratio of the whole-cell solution volume to glass beads weight being 2:1 in 1.5 mL ep tubes. Then, the prepared products were ground for 15 minutes in total (ground for 1 min and cooled in ice for 1 minute), and centrifuged at 9,000 × g at 4°C for 20 minutes. After that, the supernatant was later centrifuged at 100,000 × g at 4°C (BECKMAN COULTER Optima™ L-80 XP Ultracentrifuge) for 60 minutes. The precipitate was reconstituted with potassium phosphate buffer (pH 7.4) according to the ratio of weight to medium volume 1: 1. The microsome solution was stored at -80°C until use.
2.8 Determination of microsome protein concentration
A Lowry protein concentration determination kit and spectrophotometer were used to determine the A650 value of BSA protein standard with different concentrations to prepare a standard curve, which was then used to calculate the protein content of the RHCYP2C8 yeast microsome suspension. The operation procedure followed to the instruction manual of the Lowry protein concentration determination kit.
2.9 The procedure of RHCYP2C8 yeast whole-cell incubation
The incubation mixture of RHCYP2C8 yeast whole-cell included 1mL RHCYP2C8 yeast whole-cell solution, 1 mL 0.1 mol/L potassium phosphate buffer (pH 7.4), 0.2 mL 20% D-(+)-Glucose solution, 0.2 mL sterile water and finally 0.1 mL 10 mmol/L AQ and dissolved in water to initiate the reaction. The final concentration of AQ was 0.5 mmol/L. The mixture tubes were incubated at 30°C, 200 r/min-1 in constant temperature shaker.
2.10 Enzymatic kinetic studies of RHCYP2C8 yeast whole-cell
Incubation time, yeast concentration, and substrate concentration were optimized to ensure the linearity of DEAQ concentration. For each incubation, three independent experiments were conducted.
- The whole-cell incubation mixture described above was used. Samples were taken at 0, 0.25, 0.5, 0.75, 1, 2, 3, 4, 5, 6, 7, 8, 12, 24, and 48 h after the start of the reaction to investigate the linearity between time and DEAQ concentration.
- The conditions described above were repeated, but the reactions were terminated after 4 h. The yeast concentration was set from 0.0125 to 0.25 g/mL to examine the linearity between yeast concentration and concentration of DEAQ.
- Incubations were carried out with the concentration of AQ ranging from 50 to 500 μmol/L, and with the concentration of yeast was 0.1 g/mL. The reactions were terminated after 4h.
2.11 The procedure of RHCYP2C8 yeast microsome incubation
The incubation mixture contained potassium phosphate buffer (pH 7.4), 1.3 mmol/L NADPH (A (NADP+ 26.1 mmol/L, D-(+)-glucose 6-phosphate 66.0 mmol/L, magnesium chloride 66.0 mmol/L): 20 μL, B (glucose 6-phosphate dehydrogenase 40 U/mL): 4 μL), yeast microsome solution (protein concentration was 141.67 mg/mL) and 24 μL NADPH solution. The total volume was 0.4 mL. The final concentration of AQ was 5 μmol/L. The mixture containing microsomes and NADPH solution was pre-incubated for 10 min at 37°C, and then a 10 μL AQ solution (0.2 mmol/L) was added to initiate the reaction.
2.12 Enzymatic kinetic studies of RHCYP2C8 yeast microsome
The incubation time, microsome protein concentration and substrate concentration were optimized to ensure the linearity of DEAQ concentration. For each incubation three independent experiments were carried out.
- The microsome incubation mixture described above was used. Samples were taken at 0, 10, 20, 30, 40, 50, 60, 90, 120, and 150 min after the start of reaction to investigate the linearity between time and DEAQ concentration.
- The conditions described above were repeated but the reactions were terminated after 40 min. The microsome protein concentration was set from 38.71 to 193.54 mg/mL to examine the linearity between microsome protein concentration and concentration of DEAQ.
- Incubations were carried out with the concentration of AQ ranging from 1 to 15 μmol/L, and with the final microsome protein concentration was 116.12 mg/mL. The reactions were completed after 40 min.
2.13 The procedure of DDI experiments in vitro
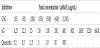
Quercetin was chosen to be the positive inhibitor as it is classified as a preferred probe in vitro inhibitor study of CYP2C8 by the US FDA [4]. All inhibitor solutions were prepared in DMSO to make the highest final concentrations of quercetin, 6G and GSC be 500 μmol/L, 6400 μmol/L and 1200 μg/mL, respectively (Table 1).
The inhibition study was carried out in the presence of inhibitors of different concentration levels under the conditions described above. All of the inhibitors added to the incubation systems were dissolved in DMSO. Incubation mixture included potassium phosphate buffer (pH 7.4), 1.3 mmol/L NADPH, yeast microsome solution (final protein concentration was 116.12 mg/mL), 4 μL inhibitor solution, and 8 μL AQ solution. The total volume was 0.4 mL. The final concentration of AQ was 4 μmol/L. The inhibitor or control solvent (DMSO) were preincubated with microsomes and NADPH before the addition of AQ to initiate the reactions. The final proportion of organic solvent was 1% (v/v) or less in the incubation system. All groups were conducted in triplicate.
2.14 Reaction termination and sample preparation
The reaction was completed by the addition of 200 μL of methanol to 100 μL sample and vortexed for 1 minute. Samples were centrifuged at 12, 000 r/min at 4°C for 10 min, and the supernatant was subjected to HPLC.
2.15 HPLC method
Samples were analyzed on SHIMAZU LC-2010AHT HPLC system coupled with a UV detector, and the separations were performed on a Galaksil® EF-C18H (4.6 mm × 150 mm, 5 μm) column with the column temperature being 30°C. The mobile phase consisted of methanol -0.1 mol/L ammonium acetate (9: 91, v/v, adjusted pH to 3.0 with acetic acid), the flow rate which was 1.0 mL/min, the detection wavelength was 340 nm, and the injection volume was 10 μL.
2.16 Validation of HPLC method
The retention time of DEAQ and AQ was 6.16 min and 7.04 min, respectively, and the blank matrix did not disturb the determination. The limit of detection was 0.1 μg/mL, and the limit of quantity was 0.25 μg/mL.
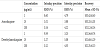
Standard curves of yeast whole-cell system were established by analyzing six concentrations of AQ and DEAQ, ranging from 1 to 200 μg/mL by least squares regression. Standard curves of AQ and DEAQ were Y = 6442*X+505.7 (r = 0.999) and Y = 6446*X+478.6 (r = 0.999), respectively. The intraday and interday precision and accuracy were determined by analyzing three replicates of three concentrations, which were 1, 25, and 200 μg/mL (Table 2).
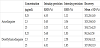
Also, standard curves of the yeast microsome system were established by analyzing six concentrations of AQ and DEAQ, ranging from 0.25 to 25 μg/mL by least squares regression. Standard curves of AQ and DEAQ were Y = 6296.6*X+3.0388 (r = 0.999) and Y = 6033*X-2.0711 (r = 0.999), respectively. The intraday and interday precision and accuracy were determined by analyzing three replicates of three concentrations, which were 0.25, 2.5, and 25 μg/mL (Table 3).
2.17 Data analysis
Kinetic parameters (Km and Vmax) of whole-cell and microsome were calculated according to the standard Michaelis-Menten equation by the GraphPad Prism 8.3.0 software.
The Lineweaver-Burk plot is obtained by inversion of the Michaelis- Menten equation:
(v: velocity of reaction, Vmax: maximal reaction velocity, Km: the substrate concentration at which the reaction velocity is half-maximal, [S]: substrate concentration)
The IC50 value was estimated from the percentage reduction in CYP2C8 activity at different inhibitor concentrations compared to the control. The area ratio of the metabolite in the sample without inhibitor was considered as 100%. The CYP2C8 activity at each inhibitor concentration was calculated with the following equation:
The non-linear regression model in GraphPad Prism 8.3.0 software was used to calculate the IC50 values of different inhibitors.
The volume per dose index (VDI) values of 6G and GSC were calculated in order to predict the potential of inhibition in vivo. The VDI of 5L was defined as one daily dose would be diluted to approximately the blood volume in humans to obtain the corresponding IC50 concentration that would cause CYP enzyme inhibition [19]. Thus the cut-off value of VDI in our study was 5.00.
(RDI: recommended daily dose).
3. Results
3.1 Enzyme kinetics of RHCYP2C8 yeast whole-cell reaction system
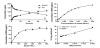
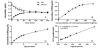
As is shown in Figure 1, the rate and extent of DEAQ and AQ metabolism by the whole-cell system were identical and finally became nonlinear from 4 h during the incubation period (Figure 1A). The production of DEAQ was also linear with the yeast concentration and AQ concentration from 0 to 0.1g/mL and from 0 to 100μmol/L, respectively (Figure 1B, Figure 1C). Therefore, we selected the incubation time of 4 h, yeast concentration of 0.1 g/mL, and 100 μmol/L of AQ to ensure a linear condition of concentration of DEAQ.
The kinetics for AQ in the RHCYP2C8 yeast whole-cell system followed the Michaelis-Menten model (Figure 1D). The Km and Vmax were 89.77 μmol/L and 0.33 μmol/h•g yeast, respectively.
3.2 Enzyme kinetics of RHCYP2C8 yeast microsome reaction system
As is shown in Figure 2, the rate and extent of DEAQ and AQ metabolism by the microsome system were also identical and quickly became nonlinear from 40 min during the incubation period (Figure 2A). The production of DEAQ was linear with the microsome protein concentration and AQ concentration from 0 to 116.12 mg/ mL and from 0 to 4 μmol/L, respectively (Figure 2B, Figure 2C). Therefore, we selected the reaction time of 40 min, 116.12 mg/mL of microsome protein, and 4 μmol/L of AQ to ensure a linear condition of concentration of DEAQ.
The enzyme kinetics for AQ in the RHCYP2C8 yeast microsome system followed the Michaelis-Menten model (Figure 2D). The Km and Vmax were 6.20 μmol/L and 0.12 μmol/h•g protein, respectively.
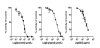
3.3 DDI results of Gingerol Soft Capsule and 6-gingerol
As shown in Figure 3, the IC50 values of 6G, GSC, and quercetin were 612.5 μmol/L, 464 μg/mL, and 6.370 μmol/L (1.92 μg/mL), respectively. The IC50 value of quercetin was smaller than that of 6G and GSC. The VDI value of 6G was 0.299, and that of GSC was 3.810.
4. Discussion
The in vitro study of CYP450s with probe substrates in recombinant human CYP450 yeasts is a new method for predicting potential DDIs and metabolic pathways. It meets the needs of new drug research and development institutions, overcomes the shortcomings of traditional research methods, and also facilitates the in-depth study of metabolic enzymes. Lim, et al. [20] used recombinant CYP450s to study the inhibitory potencies of the khat extract and the results showed that it is possible to cause DDI when co-administered with drugs metabolized by CYP2C9, 2D6 and 3A4. Zhuang et al. [21] investigated the metabolism pathways of novel anti-HIV agent CMDCK and found it was mainly metabolized by CYP2A4 and CYP3A5. However, unlike other frequently studied enzymes such as CYP3A4, 1A2, and 2C9, CYP2C8 is not a research focus for the metabolic pathway screening and DDI research.
The design of this study was to use RHCYP2C8 yeast to establish a preclinical drug metabolism pathway and DDI research system, with AQ as the probe substrate and further explore potential inhibition of 6G and GSC on the CYP2C8 activity in vitro.
We investigated the enzyme kinetic parameters of RHCYP2C8 yeast whole-cell and microsome reaction systems. The results show that both the whole-cell and microsome reaction systems fit the Michaelis- Menten model, while the values of kinetic parameters markedly differed. The Km values of the microsome reaction system were close to the reported values of HLM, which were 3.33-5.17 μmol/L and 3.9-7.3 μmol/L, respectively [22,23]. Compared to the microsome reaction system, the kinetic parameters of the whole-cell reaction system were approximately 10 times greater. The reaction velocity of the whole-cell reaction system is slower than that of the microsome reaction system. The reason may be that the incubation temperature is 30°C instead of 37°C in the microsome reaction system.
In this study a drug metabolite screening and DDI research system by RHCYP2C8 yeast were constructed, and conditions for microsome reaction system included potassium phosphate buffer (pH 7.4), 1.3 mmol/L NADPH, RHCYP2C8 yeast microsome solution (final protein concentration was 116.12 mg/mL), 4 μL inhibitor solution (for DDI research), and 8 μL AQ solution. The total volume was 0.4 mL and the final concentration of AQ was 4 μmol/L. For the wholecell reaction system, it can be applied for the preliminary screening of drug metabolic pathways and preparation of drug metabolite due to its advantage of omitting microsome extraction which is timeconsuming and expensive. The whole-cell reaction system included potassium phosphate buffer (pH 7.4), RHCYP2C8 yeast whole-cell solution (final yeast concentration is 0.1 g/mL), 20% D-(+)-Glucose solution and AQ solution and inhibitor solution (for DDI research). The total volume is 2 mL. The final concentration of AQ is 100 μmol/L.
The reaction needs to be protected from light to avoid the photodecomposition of DEAQ. Mihaly et al. have reported that DEAQ is readily absorbed in glass, so glass containers should also be avoided [24,25].
Then, we used the RHCYP2C8 yeast microsome reaction system to investigate the impact of 6G and GSC on AQ metabolism in vitro. The IC50 value of quercetin was consistent with the value reported in the literature which was 3.9-6.2 μmol/L. It demonstrated that the results of DDI research are credible, and the RHCYP2C8 yeast microsome reaction system can be used for DDI research [26].
According to the general rules for intensity classification of CYP enzyme inhibitors, IC50 of potent inhibitors is lower than 1 μmol/L, moderate inhibitors are between 1 and 10 μmol/L, and weak inhibitors are over 10 μmol/L [27]. For this reason, the intensity of 6G to CYP2C8 is considered to be weak. IC50 of GSC contents (464 μg/mL) is lower than IC50 of 6G (180.31 μg/mL), based on 6G concentration in it, which was determined to be 30.54 μg/mL. Several components that also have inhibition potencies to CYP2C8 may contribute to these results. Curcumin, which is one of the ingredients in GSC, was found showing inhibition of CYP2C8 (91%) at 10 μmol/L in an in vitro study [28]. In another study, the IC50 values of 6-paradol, 8-gingerol, and 10-gingerol to CYP2C8 were reported to be 5.1 μmol/L, 0.7 and 0.7 μg/mL [29,30].
The VDI value of 6G was 0.299, and that of GSC was 3.810 according to the recommended daily dose of GSC, which is 3 capsules (17 mg 6G per capsule), approximately 1.77 g GSC contents. Both the VDI values are lower than 5.00, indicating weak inhibition in vitro. It was reported that the maximum plasma concentration of 6G was 0.85 ± 0.43 μg/mL after 2.0 g ginger extract (contained 10.76 mg 6G) oral administration [31]. Moreover, according to Yu et al. [32], it is considered that 6G is rapidly metabolized in the human body and the free form of 6G cannot be detected in human plasma over 24 h after oral administration of 2.0 g ginger extract. Tissue distribution research of ginger extract showed that gingerol target organs were stomach, liver, lung, and kidney, thereby indicating that the liver was the main metabolized channel [33]. The liver concentration of 6G is 35 folds greater than that in rat plasma at 0.08 h, 100 folds at 0.5 h, and 30 folds at 2 h reported by Jiang SZ et al. [34]. Even though liver concentration of 6G is substantially greater than plasma concentration, IC50 of GSC and 6G observed in the current work still indicated the low possibility of DDI. Because GSC contains various components, and some of the other active constituents also showed inhibitory effects to CYP2C8, the inhibitory effects of ginger extract to CYP2C8 probably are either synergistic or additive from other phenolics in it [30]. Combined with all above, when both administrated concurrently or at different times, there would be no potential DDI for drugs that are metabolized by CYP2C8 caused by GSC or 6G in humans.
In summary, an efficient system for metabolite screening and DDI research by RHCYP2C8 yeast was established and its efficiency above traditional methods was validated. This system was found to be an alternative tool for the HLM, and can significantly cut down on the numbers of animals used, thereby reducing the cost. Also, the results indicate that neither GSC, nor 6G appears likely to pose a risk of producing clinically DDI mediated by CYP2C8, but animal experiments or clinical studies should be augmented for further verification.
Competing Interests
The authors declare that they have no competing interests.
Author Contributions
Qiyue Zhang, He Zhu and Hanhan Li conceived the study. Qiyue Zhang managed the data, conducted the analyses and wrote the methods and the results with contributions from He Zhu and Hanhan Li. Changqing Yang, Wen Qian, Xijing Chen and Toshiyuki Sakaki gave scholarly input in this work, provided critique and overall management. All authors have approved the final version of the manuscript.
Acknowledgments
The authors would like to acknowledge Nanjing BRT-Biomed Co., Ltd for providing recombinant CYP450s yeasts, and thank Charles D. Sands (PharmD, Professor and Former Dean, McWhorter School of Pharmacy College of Health Science Samford University, Birmingham, Alabama, USA) for grammar assistance.