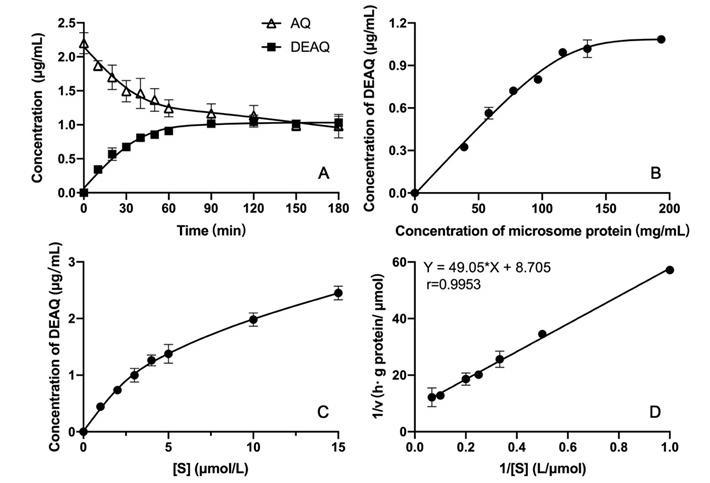
Figure 2: Plots of enzyme kinetic research in the RHCYP2C8 yeast microsome reaction system.
A: Plot of incubation time vs amodiaquine and desethylamodiaquine concentration. B: Plot of protein concentration vs desethylamodiaquine concentration. C: Plot of substrate concentration vs desethylamodiaquine concentration. D: Lineweaver-Burk plot for the determination of the kinetic parameters in the recombinant human RHCYP2C8 yeast microsome reaction system. (n = 3 Mean ± SD).
A: Plot of incubation time vs amodiaquine and desethylamodiaquine concentration. B: Plot of protein concentration vs desethylamodiaquine concentration. C: Plot of substrate concentration vs desethylamodiaquine concentration. D: Lineweaver-Burk plot for the determination of the kinetic parameters in the recombinant human RHCYP2C8 yeast microsome reaction system. (n = 3 Mean ± SD).