


1. Introduction
This short methodological paper presents reasons for applying recurrent pattern detection such as T-Pattern detection and Analysis (TPA) in behavioral research and an essential description of the so called T-System of related structural concepts, where the T-Pattern is central, and references to published TPA research applications in areas from neuronal to human interactions described among other in two edited books [1,2] and in published papers [3].
TPA has now been applied in many different areas from sports and deception in human interactions to neuronal interactions within living brains, while T-Patterns also exist on DNA indicating that the T-pattern model provides a fairly adequate description of an inherent kind of repetitive patterns found at many levels of biological organization, but often hard or impossible to detect through unaided observation or with traditional methods, while highly significant T-patterns have been found almost everywhere they have been searched for in intra- and inter-individual behavior. As should be expected, given the abundance of T-patterns, the results obtained with TPA are usually different from those obtained with analyses of frequencies and durations or with standard multivariate and sequential analysis of directly coded (recorded) behavioral categories.
Searching for hidden repeated patterns may not seem useful given plenty of obvious ones, but many right in front were only recently discovered with adequate tools, and basic grammar was still unknown after thousands of years of talking.
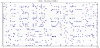
Recurrence of a limited number of patterns such as words or gestures, seems a universal characteristic of behavior, but key to the detection of recurrent patterns of these in complex behavior and interactions, whether verbal, non-verbal or both and sometimes involving environmental events, is formally defining the kind of patterns to search for allowing the development of computational detection algorithms. Given the universe being fractal [4] and thus characterized by self-similarity (resulting from the balancing of a small number of universal forces of pushing and pulling [5]) there seems to be a fundamental reason for expecting self-similar patterns in behavior. While mathematical fractals are exact and infinite, those found in nature (called pseudo fractals) are finite and approximate (statistical) usually spanning only a few orders of magnitude [6], but each may recur similarly at different times and locations, as do T-patterns, characterized by statistically significant translation symmetry [7] (Figure 1).

Somewhat surprisingly, possibly because of lack of adequate pattern models or a clear preference for any particular ones, even widely used statistical packages did not for decades provide powerful tools for the detection of repeated complex patterns in time in the above sense, focusing instead on relationships between attributes of known entities.
Duncan and Fiske [8] distinguished between a) Structural Analysis concerned with the discovery of the structure of dynamic streams of behavior without necessarily comparing them, and b) External Variable Analysis focusing on comparison of samples typically grouped by independent variables, while typically relying on simple measurements such as frequencies and durations of coded behaviors.
While purely structural analysis is primary in TPA, combining structural and external variable analysis is typical in TPA based studies and the Theme software provides special functions for the analysis and comparison of sets of patterns detected in different samples. Patterns may thus, for example, be found that occur exclusively or significantly more in certain sets of samples typically collected under different conditions. Statistical tables describing the detected patterns can be output for standard statistical analysis looking for experimental effects on T-pattern parameters such as, frequency, average or maximum length, number of actors or alternations between actors, etc., often finding significant experimental effects missed when using standard methods alone. This points to a possible practical, economical and even ethical consequence of the intensive use of data in TPA that remains to be more systematically explored: the possibility of discovering experimental effects using fewer or shorter trials and fewer subjects.
2. Method
Essential formal definitions of the T-Pattern and some other T-System concepts are given below but further treatment can be found elsewhere [9-16]. All definitions and detection algorithms refer to so called T-Data, which may be generated under either experimental or natural conditions, but consists of the occurrence times of discrete events on a discrete scale recorded using any methods, for example, coded with a smartwatch app such as Theme Watch or from video using a multimedia tool such as T-Coder (see www.patternvision.com) or automatically, for example, with a chip within a brain registering each spike from each of a number of individual neurons in close proximity [17]. Behavioral, environmental and/or physiological data can be merged and analyzed together as long as all data is represented as T-data, that is, as discrete time-stamped events within the same observation period(s). For this, analogous data must first be transformed into time stamped event data, for example, (start, max or min, or end) times of peaks and troughs on each channel. T-Data is thus a set of series of occurrence times, one for each type of event, such as the tops of peaks on one channel and the ends of troughs on another.
3. The T-Data Type
T-Data is composed of a number (>=1) of discrete points(or events) within an interval [1,T] on a single discrete dimension. In the initial T-Data, each (integer) series represents the instances of a different event-type, typically the n beginnings (or endings) of some (behavioral) state considered by the algorithm as a simple series of discrete points [ti]i=1..n or, equivalently, as unit intervals [t1i, t2i]i=1..n, where t1i = t2i, but t1i<= t2i for the series of occurrences of each detected T-Pattern (with t1i for its beginnings and t2i for its ends), which is added to T-Data. A separate list of correspondences between occurrence series and initial event-types or detected T-patterns is constructed. The detection algorithm treats all the initial and added T-data series in essentially the same way and all definitions of the T-System terms refer exclusively to T-Data. A number of T-data can (in Theme) be simply concatenated into multi-sample T-data where patterns cannot cross sample boundaries. T-data files for Theme are tab delimited standard .txt files with only two columns: time and event, for example, 279 sue, b, smile, that is, at (within) time unit 279 sue begins to smile.
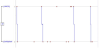
All the illustrative T-pattern examples (figure 3-figure 8) below refer to the (single-sample) T-data shown in figure 2.
4. T-Pattern Definition
A T-pattern is m ordered components, X1..Xi..Xm any of which may be primitives or T-patterns, on a single discrete dimension (here time), such that, over the n occurrences of the pattern each of the distances Xi→Xi+1 = tXi+1 -tXi; i = 1...m-1, varies within a typically different significantly small interval, called a critical interval (CI): [di1, di2]:
X1 [d1,d2]1 X2 [d1,d2]2...Xi [d1,d2]i Xi+1…Xm-1 [d1,d2]m-1 Xm(m = length)
5. Detection Algorithm
Any T-pattern Q = X1 X2..Xm can be split top-down into at least one pair of shorter ones related by a corresponding critical interval: QLeft [d1,d2 ] QRight
Recursively, QLeft and QRight can thus each be split top-down until the pattern X1, X2..Xm is expressed as the 1 to m terminals (primitives, event-types) of a binary-tree of critical interval relations. A critical interval with d1= 0 is called a fast critical interval.
The detection algorithm consists of a few sub-algorithms for, respectively, critical interval detection, pattern construction and pattern completeness competition where redundant (equivalent) or partial detections of the same underlying patterns are dropped. Patterns are thus selected and evolve through a completeness competition comparing the event-types and their occurrence points of a detected pattern to all already detected patterns and dropping all partial and equivalent patterns, equivalent meaning the same underlying pattern detected with a different binary tree.
T-Patterns are thus constructed bottom-up as binary trees of detected significant critical interval relations between event-types and/or detected T-patterns and the occurrence series of detected patterns are added to T-Data. As the occurrence of a T-Pattern spans an interval from its first to its last (m’th) event type, so its n occurrences are represented by the series of these n intervals (pair of series in T-Data).
Instances of a T-pattern may thus be viewed as hierarchical and selfsimilar statistical pseudo fractal patterns characterized by significant translation symmetry between their occurrences, see figure 3 and figure 4. At the top of figure 4 see the four (n=4) dynamical versions of the (left) binary detection tree.
Theme provides statistical (Monte Carlo) validation features both globally and for each pattern.
All the illustrative detection examples below concern a 13.5 min toy-play dyadic interaction between two 5-year-olds called x and y with the T-Data shown in figure 2.
Our formal university network of research teams at over thirty universities in Europe and America, called “Methodology for the Analysis of Social Interaction” (MASI), http://hbl.hi.is/masi, has for many years applied TPA with Theme in numerous research areas, but has not yet found similar pattern types, detection algorithms and software [1,2].
6. The T-System
Building on the critical interval and the T-Pattern concepts, extensions have been defined and make up the T-System, notably, T-Bursts, T-Markers, T-Predictors, T-Retrodictors, +/- T-Associates, T-Packets and T-Composition; T-Bursts, T-Markers, T-Predictors and T-Retrodictors will be defined and illustrated below.
7. T-Bursts
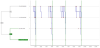
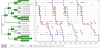
The T-Burst is behavior (event-type or T-pattern) that sometimes occurs repeatedly with significantly shorter distances between its occurrences than average. It is thus a special (univariate) kind of T-Pattern relating a series to itself, lag-one, by aspecial fast critical interval [1, d] and occurrences separated by a distance 1 ≤ t ≤ d form the occurrence of a T-burst. T-bursts often provide greatly increased predictability of other behavior. Figure 5 shows a T-burst in event type x, b, automanipulate, meaning x begins fiddling with something without paying attention to it. To indicate where the instances of a burst begins and ends, the series is shown twice indicating the start of a burst in the upper series and the ending in the lower series. This way of presenting T-bursts is also used when a T-pattern occurs in bursts as shown in figures 6-8 for the simple T-pattern (x, e, automanipulate x, b, automanipulate).
8. T-Markers, T-Predictors and T-Retrodictors
T-Patterns represent often complex conditional probabilistic and significantly timed relations between behaviors, which like all critical interval relations, may be causal or not. The observation of behavior that sometimes occurs as a component of a particular T-pattern, Q, is thus indicates more or less strongly that Q may be ongoing, in progress and possibly beginning or ending. In strong cases, it may thus provide some possibility of foresight and/or hindsight.
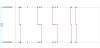
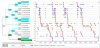
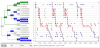
An x% T-marker of T-pattern Q is behavior with x% of its instances occurring as components in Q thus indicating with x% probability that Q is ongoing (figure 6) and depending on its position within the pattern, it is a T-Predictor (figure 7) or a T-Retrodictor (figure 8) of what may, respectively, follow or precede it with x% probability (x thus also called the marker-level). Except for markers at positions 1 or m in a T-Pattern all its terminal event-types and sub-patterns may thus be both a T-predictor and a T-retrodictor.
Figure 6, Figure 7 & Figure 8, created with Theme, show in three different ways a T-Pattern detected in a 13.5 min interaction between two toddlers focusing on the markers (green) and retro- (blue) and predictors (aqua) as well as T-bursts and their importance for prediction and retrodiction.
The meaning of the labels (event types) on the vertical axis: x and y are the two toddlers; b or e = begin or end; viewer = a picture viewer; automanipulate = fiddling with something without paying attention to it; view, long = looking at a picture in the viewer for >= 3 s; lookat, partner = looks at the other; lookat, pictcard = looks at picture card (not in viewer); manipulate, viewer = handles the viewer. Example: Y, b, have viewer = Y begins having the viewer on her side. X-axis is time in video frames or 1/15 s.
9. Results
As already noted, the above T-pattern detection results are for illustration, but successful applications of TPA in many different research areas have been published, among other, in two edited books about TPA applications [1,2] and comprehensive review also provides a guide to various applications [3]. Some very recent examples will be mentioned here. An essential aspect of TPA is the possibility of analyzing the content and structure of detected patterns often to search for effects of external variables on the positioning of behaviors (that is, somewhere from X1 to Xm). Thus by exporting the detected patterns to Excel a particularly thorough statistical analysis has, for example, found such effects in an experimental study of deception in human social interactions [18]. Pharmacological experimental animal studies using TPA have recently been published [19]. Facilitating objective and quantitative analysis of the often short human therapeutic interactions in clinical contexts was among the initial motivations driving the development of T-Patterns and Theme, but still such applications are rare and none are pharmacological. However, two studies based on psychiatric interviews have been published [20,21].
10. Discussion
The T-System provides formally defined structural elements for the description and analysis of real-time behavioral records and the corresponding algorithms and software have often added diagnostic power as well as new insights through otherwise unnoticed patterns and even practical and ethical advantages due to more intensive use of data. In some cases a price to pay is the addition of time stamps to all recorded (coded) events while the approach also favors the coding of more types of behavior, including rare ones.
Analyzing tiny data: One useful aspect of TPA due to the T-Pattern model and the intensive use of real-time information, is the detection of rare and sometimes complex patterns in data sometimes considered too small for standard statistical analysis. For example, T-Data (samples) with possibly only two or three occurrences of each of a small number (>=1) of different behaviors (for example, the detection of a T-Burst only requires three occurrences of the same event). It can be said that with TPA, that every moment (time unit) when some of the event types in T-Data is not happening also counts as data, thus sometimes changing small data into big data for TPA [16].
Fewer samples, trials and subjects: Another aspect of TPA indicated by previous studies and also due to the particular and intensive analysis of each sample, fewer subjects and shorter observations may be needed for the detection of significant (experimental) effects thus, among other, reducing economical and ethical cost, but in spite of clear hints, this remains an untested but empirically testable hypothesis.
Rare events and a tool for their coding: The most important events are often rare, still it is often assumed that rarity indicates low importance and high frequency great importance. Traditional statistical methods typically also deal better with frequent events, which may explain a tendency to ignore rare behaviors. TPA deals effectively with rare events justifying the development of the Theme Watch app (figure 1) for manual coding of rare events by simply tapping items of an editable list on a smartwatch screen to create T-data for TPA that can also be merged with other simultaneously collected data using other manual or automatic techniques. ThemeWatch could therefore, for example, help identifying time constrained combinations of causes for allergies as using the app the patient can easily record such automatically time stamped events and by a simple push send the data to a previously specified email address, if and when he wants.
A weakness in the T-pattern model and detection algorithm is lack of consideration of possible alternatives (substitutes) at the same T-Pattern positions (like, for example, saying yes or nodding). Each Xi in the T-Pattern definition should thus be a list (of length ≥1) of alternative components (event-types and/or T-patterns) at the i’th position. Due to the large amount of patterns detected with the current algorithm this improvement has not been pressing, but an extension is planned, while keeping the algorithm as simple as possible to explain and maintain.
Finally it should be noted that research applications of some of the latest additions to the T-System and the corresponding features in the Theme software have not yet been published.
11. Conclusion
Adding a recurrent pattern detection step in traditional statistical analyses of real-time behavioral records can have advantages as is confirmed by TPA in many research areas [1,2]. But adding this step can sometimes seem dramatic, somewhat like switching from word counts to grammatical inference or from counting and analyzing atoms to detecting, counting and analyzing molecules possibly adding crucial diagnostic possibilities. TPA should thus be seen as an added analytical step between data collection and normal statistical analysis complementing traditional statistical approaches, while sometimes providing qualitative insights through the detection of invisible or easily overlooked patterns.
Like most multivariate and pattern detection methods, TPA can be hard to fully understand, but very few TPA users are specialists in pattern recognition, multivariate statistics, computer science or the like and the development of the T-System and Theme is still guided by a wish to create a tool, hopefully one day an expert system, understandable and useful for researchers without such background. TPA with Theme should thus be accessible for most researchers.
The ThemeWatch, combined with TPA with Theme, may be useful in numerous clinical contexts where better information about temporal patterns of both subjective and environmental events in the everyday lives of patients (within or outside hospitals) is needed regarding mental and physical health, for example, about timing of psychological or physiological symptoms relative to social and environmental events and use of medication.
T-Patterns are scale independent and results of TPA of data with temporal resolutions from 10-6 [17] to days [22] has been published. TPA of data with various temporal resolutions has been suggested, for example, profiling based on T-Patterns of events detected in patient or inmate histories or concerning the progression of illness and treatment, but considerable time stamped data for such analysis are available in medical, hospital and other institutional records (data bases). TPA has been applied in animal cancer research [23] and has informally been suggested for the detection of patterns in complex physiological processes, for example, changes in tissue leading up to experimentally induced cancer tumors.
Competing Interests
The author is the copyright holder of THEMETM and since 2000 the founder and majority owner of PatternVision Ltd (see www.patternvision.com), which now markets the behavior analysis software that he has developed since the late seventies at European universities and applied in research in broad international collaborations.