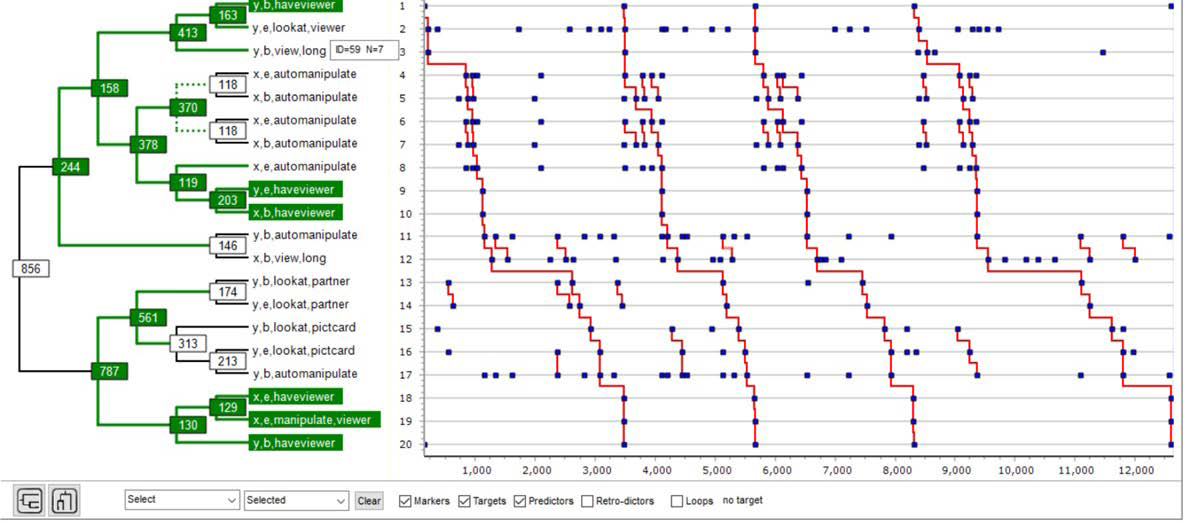
Figure 6: In this diagram of T-pattern 856, T-marker nodesat the 80% marker-level are indicated with green color. Notice that node 370, marked as a burst with a dotted connection, is a burst of pattern 118 and is a T-marker, while none of its parts are.That is, a T-burst of a behavior here provides better prediction of the occurrence of the whole pattern (856) than any ofthe components of the T-burst.