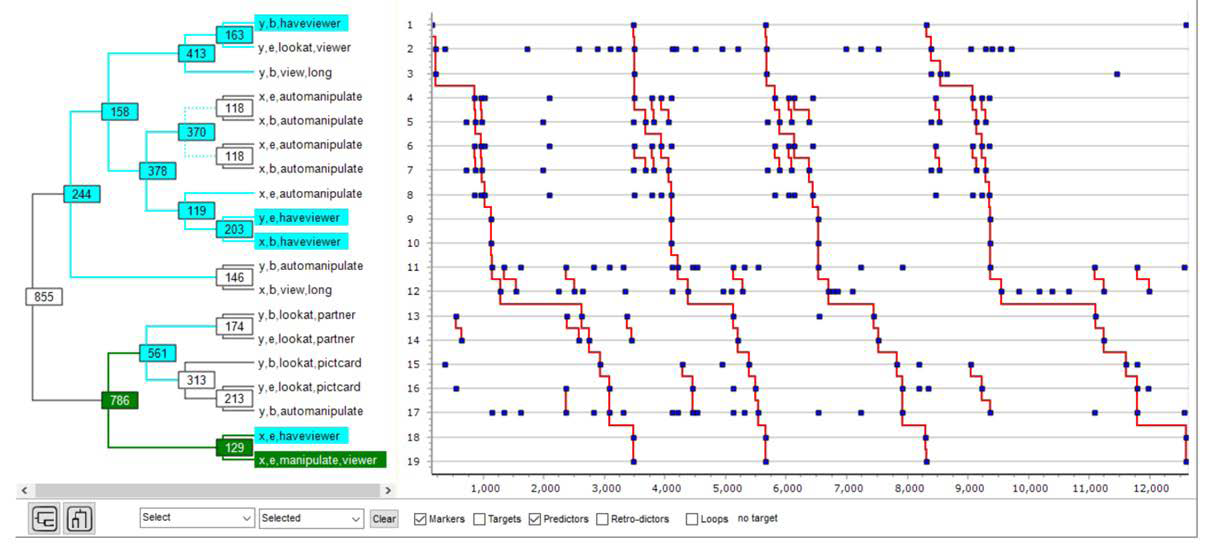
Figure 7: As in figure 6 and at the same 80% marker level, this figure shows T-markers in green except for T-predictors shown in aqua color. Note that node 370, marked as a burst with a dotted connection, is among the T-predictors, but none of its parts (node 118 and its terminals) are, the T-burst thus providing stronger prediction than any of its parts.