


1. Background
Hypovolemia and a reduction in blood sodium levels, even to the point of hyponatremia, have been reported in some athletes who lose large volumes of sweat, such as ultra-endurance athletes, football players, and athletes with cystic fibrosis [1-8]. The amount of sodium in human sweat varies widely within and across individuals [9], and, even though the spot ion concentration is consistent over time in acclimated individuals, that concentration has also been demonstrated to be directly proportional to percent plasma volume loss, it may serve as useful proxy indicator of hypovolemia [10,11]. While the need for electrolyte replacement continues to be debated, it is the consensus that, for athletes with salt wasting diseases such as cystic fibrosis (CF), salt replacement is necessary to prevent and attenuate ongoing plasma volume contraction and hyponatremia under conditions likely to result in elevated sweat sodium losses [8]. Such losses, if not addressed, can proceed from mere hypovolemia to frank dehydration.
Similar progressive plasma volume contraction has been observed in those with above normal sweat sodium levels, the “salty sweater,” and both CF patients and salty sweaters potentially experience plasma volume loss one-third greater than that of normal sweaters [11]. In addition, these cohorts, despite meaningful plasma volume contraction, do not demonstrate increased thirst, a finding that has been repeatedly described in the CF population as “voluntary dehydration” [12] but that is not yet widely described in athletes with salty sweat. Brown, et al. hypothesized that the lack of increased thirst demonstrates the priority of salt balance over volume status in protecting against hyponatremia [11]. Considering the similar physiology between these cohorts, many endurance athletes may experience the same benefits from sodium supplementation as the CF population. As laboratory-based research continues, there is a need for practical, robust tools to permit individuals to assess sweat sodium loss and guide replenishment needs during actual training and competition, i.e., in the field. This case study reports on the attempts of one ultra-endurance athlete to measure his own sweat sodium concentration from regional patch samples using the Horiba LAQUA twinB-721 Compact Salt Meter and the AquaChek test strips during routine training sessions. Two pilocarpine induced sweat tests on this same individual are offered for comparison.
We are aware of only two reports of sweat sodium testing by sodium ion-specific potentiometers, i.e., the Horiba C-122 [13] and its successor the Horiba LAQUAtwin B-722 [14],that suggest each to be of practical use for field testing during endurance sports. The Horiba LAQUAtwin B-721 Compact Salt Meter® (Horiba, Kyoto, Japan)is the counterpart of the Horiba B-722 and has a detection range of 0.1-10% (17.1 – 1710 mEq/L), making it more appropriate than the B-722 for use in cystic fibrosis patients who can have sweat sodium levels well above 100 mEq/L. It measures the sodium concentration of any fluid using a sodium-specific ion electrode method and reports results in percent sodium chloride by weight [%NaCl] with a range of 0.1% to 10% and an accuracy reported by the manufacturer to be within +/- 10% of the reading value.
A literature search revealed no reports on the use of AquaChek® testing strips for sweat sodium measurement. AquaChek strips are manufactured by Hach (Aquachek White Salt Titrators, ETS/Hach, Elkhart, IN)and marketed for the purposes of measuring swimming pool salinity. However, Hach specifically mentions that the original use of this particular test strip reagent technology was in the field of medicine [15]. The AquaChek strip measures sodium content of water in parts per million (ppm) with a range of 400 ppm to 7000 ppm (i.e., 6.84 to 119.78 mEq/L) which conveniently overlaps the full range of human sweat sodium concentrations anticipated.
Whole body wash-down (WBW) is considered to be the gold standard for sweat collection with electrolyte determination but it is untenable for field use because it requires the collection of all sweat. Regional sweat patch collection provides a viable alternative to WBW in the field, and several studies have demonstrated that this collection method can be used to estimate WBW amounts with reasonable accuracy using regression analyses [16,17].
2. Case Description
A 44-year old, male physician with ten years of experience in long distance triathlons and endurance racing reports having been a “salty”, heavy sweater since his teen years and has noted significant weight loss, at times as much as 10% of his total body weight, during some efforts alongside symptoms that could be attributed to hypovolemia (lightheadedness, nausea, fatigue, tachycardia, etc.) despite drinking to thirst. When racing or training less than 3 hours in moderate conditions, he practices drink to thirst guidelines and does not supplement salt. However, under hot, humid conditions and/or efforts extending beyond 3 hours, these symptoms often develop, and he has found salt supplementation to be of significant benefit. He notes that “when I try to consume fluids to nearly match my sweat rate, my GI tract will not tolerate the volume (30-40 ounces per hour) that I often need, especially if the constellation of symptoms has already begun. Typically, I find myself feeling bloated, sick of drinking, sick of the taste of whatever I’m drinking, and unable to then prevent my standard hypovolemic constellation from crashing down on me. It may be delayed in onset, waiting until further in a race to develop, but it is not prevented. I am able to take in far more fluid when I also take in salt. My thirst mechanism seems to function more reliably when I take in salt but seems unreliable when I do not. My urine output is far greater when I take in salt (although I am also taking in far more fluid). My stomach seems to empty more quickly. I do not get bloated. I do not get sick of drinking fluid.”
He routinely records data that might relate to his performance during regular training sessions in the environment to which he exists and is acclimated. These data include ambient temperature, humidity, type of training (cycling, running, plyometrics), duration of training (minutes), weight loss (kg) and fluid replenishment. Concerns about excessive salt loss led him to try two different methods for measuring his sweat sodium concentration during training sessions. For simplicity and cost efficiency, he chose to use regional sweat patch collection at two scapular sites using a patch constructed ofsterile gauze pads adhered to the skin beneath a standard occlusive medical dressing (Tegaderm™).He found it easy to perform patch self-application to the left and/or right scapula and noted that this location provided good sweat volume and avoided contamination and/or discomfort from existing hair. All supplies used to construct a sweat collection patch were purchased over-the-counter from a local pharmacy. The training session began as soon as the patches were applied, and testing of the sweat samples using the Horiba LAQUAtwin B-721 Compact Salt Meter and the AquaChek test strips (an innovative application) occurred immediately upon completion of the training session.
All sweat sample data were recorded from August 2013 through October 2013 during the last of 3 blocks during training for the Ironman Arizonatriathlon in November of 2013, resulting in a high level of fitness. Running sessions were completed outdoors on the road. Cycling sessions were completed either outdoors on the road or indoors on a trainer. Plyometric sessions were completed indoors. Potential contamination of the sweat samples is a concern and prevention measures were taken by cleaning of hands with soap and water prior to both application and removal of the sweat patch from the skin. The gauze patch was removed from the adhesive dressing with forceps cleansed with rubbing alcohol and was placed directly into a clean test tube that was then capped and spun in a hand-driven centrifuge (Thomas CENTFG1 Centrifuge Hand Driven, Thomas Scientific, Swedesboro, NJ). Instructions provided by the Horiba manufacturer were followed using one-point calibration against a 0.5% standard each day of testing prior to testing a few drops of the sweat sample. A second sample was run on each sample. The Horiba result was multiplied by 171 to convert it to [Na+] mEq/L and then rounded to the nearest hundredth. The meter was purchased on Amazon.com for $350.00.
Two pilocarpine induced sweat samples were collected from the right forearm using the Macroduct Sweat Collection System (ELITechGroup Biomedical Systems (Formerly Wescor, Inc.), Logan, Utah, USA) and the Sweat Chek Sweat™ Conductivity Analyzer (ELITechGroup Biomedical Systems (Formerly Wescor, Inc.), Logan, Utah, USA). Equipment and supplies were provided by Precision Hydration. This method is one of two that are approved by the Cystic Fibrosis Foundation for conducting sweat testing in the diagnosis of cystic fibrosis. Results are reported in mmol/L of NaCl. They are provided as a standard against which these novel methods can be judged.
Because of the subject’s personal interest and experience with Exercise Associated Hyponatremia (EAH), he had pursued genetic testing for common CF mutations through 23andMe (23andMe, Mountain View, CA) prior to the collection of this data. The subject tested negative for the following mutations: DeltaF508, DeltaF507, G85E, R117H, I148T, R334W, R347P/H, 455E, V520F/I, G542X, S549N, S549R, G551D, R553X, R560T, R1162X, W1282X, N1303K, 394delTT, 621 + 1 G>T, 711 + 1 G>T, 1078delT, 1717 2 1G>A, 1898 + 1 G>A, 2184delA, 2789 + 5 G>A, 3120 + 1 G>A, 3659delC, 3876delA, 3905insT, 3849 + 10kbC>T. At the time of testing, the American College of Medical Genetics (ACMG) recommended a 23-genetesting panel to screen for CF (28). All 23 mutations were represented within the 31 mutations examined by this kit, giving the test an overall sensitivity of 90% and specificity of 99%.
3. Results
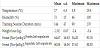
Both methods appeared to yield similar results. The data recorded during training are summarized in Table 1. The AquaChek sweat [Na+] concentration mean was 60.04 (s.d., 16.34 mEq/L), which wasbut consistently slightly lower than those of the Horiba (mean 64.67, s.d. 16.53). The Horiba [Na+] concentrations were significantly, negatively correlated with training session duration (-0.52), and positively correlated with humidity (0.38 with Horiba and 0.39 with AquaChek), but not with temperature (r=0.02). Notably, all of the highest sweat [Na+] concentrations (80.37 to 95.76 mEq/L) were observed for training sessions comprised solely of running outdoors in temperatures between 14°C and 22°C and humidity between 50% and 100% (1 missing) for at least 90 minutes.
Because the same sweat samples were measured using both tools, comparison using more formal analyses is possible, and, therefore, validity and reliability testing of the two tools against standard saline solutions was conducted. Standard saline solutions were prepared using de-ionized water and mixed with sufficient weights of iodinefree, sodium chloride crystals to yield solutions of 0.1%, 0.2%, 0.3%, 0.4%, 0.5%, 0.6%, 0.7%, and 0.8%. The scale used was a GM Series Professional Digital Jewelry Scale (http://www.smartweighscales.com/Smart-Weigh-Gems-Digital-Scale-20-x-0001g_p_13.html) by Smart Weigh Scales, Monsey, NY). It weighs up to 20g in 0.001g increments. Calibration was performed using 10g weights provided by the manufacturer. For each dilution the investigator weighed out the respective non-iodized sodium chloride gram amount (for example 0.010 g, 0.020 g, etc) and placed it in 10 mL of distilled water at room temperature. Solutions were prepared in 15 mL glass test tubes that had been rinsed with distilled water and dried with Kim Wipes. After each solution was prepared the test tube was capped with a clean rubber stopper. These dilutions were chosen to be within the physiologic range of potential sweat sodium values ranging from low normal to those of CF patients.
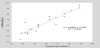
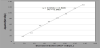
Strength of association between the Horiba and AquaChek sweat [Na+] results was evaluated using Pearson r and regression analysis. A p-value of less than 0.05 was accepted as statistically significant. The regression plot (Figure 1) of the AquaChek results against Horiba results for the same sweat samples yielded an R-square of 0.881, a moderately strong association between the two methods.
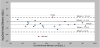
Agreement between AquaChek (novel) and Horiba methods was assessed using a Bland-Altman plot of mean differences (bias), precision (1 standard deviation, s.d.), and limits of agreement (2 s.d.) in Figure 2 [18]. The limits of agreement range from -15.91 to 6.75 mEq/L. AquaChek-Horiba differences are relatively small and consistent across the full range of sweat [Na+] concentrations evaluated. There is one clear outlier, -22.1 (corresponding to 64.98 vs. 42.07 mEq/L, Horiba vs. AquaChek, respectively) with no apparent explanation. Nevertheless, 83% (18/23) of the differences are within plus or minus 5.6 mEq/L and 96% (22/23) of the differences are within plus or minus 11.4 mEq/L.
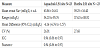
AquaChek and the Horiba measures are compared in Table 2. AquaChek results are, on average, 4.16 mEq/L (95% C.I., -6.76 to -1.57) lower than the Horiba results. The AquaChek and Horiba coefficients of variation (CV) are similar, 26.0% and 27.7%, respectively, reflecting wide variation. The intra-class correlation coefficient (ICC) is 0.94 (95% C.I. 0.86 to 0.97) indicating that most of the variation in differences between the two measures is attributable to the samples rather than to differences between the two methods.
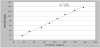
Two regression plots (Figures 3 and 4) display results of the regression plot of the AquaChek and the Horiba results, respectively, against standard saline solutions. The R-square for the AquaChek regression against standard saline solutions, is 0.9934 and for the Horiba against standard saline solutions, it is 0.9846. Both r-squares are indicative of high validity. A comparison of the data points that fall slightly above or slightly below the regression lines for both the Horiba and with the AquaChek reveals that they occur at the same standard saline solution concentrations.
For comparison, two pilocarpine induced samples were analyzed after the above data was compiled. Testing and analysis was conducted using the Macroduct Sweat Collection System and the companion Sweat Chek Sweat™ Conductivity Analyzer. Both samples were taken at rest on subsequent days. The first value was 54 mmol/L, and the second value was 48 mmol/L.
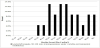
This case illustrates the experience of a 44-year old physician athlete, who self-reports symptoms consistent with hypovolemia during extended training or racing. This novel application of AquaChek test strip (marketed for testing swimming pool water) yielded results comparable to the Horiba and the strips are inexpensive and easy to use in the field. Validity and reliability of each method was excellent when tested against standard saline solutions. His average sweat sodium level across all sessions was 64.67, s.d. 16.53 mEq/L using the Horiba, which approaches the definition of “salty sweaters” (70 mEq/L) that has been used by some researchers (11) for testing under hot conditions and 40% (9 of 23) of the values greater than 70 mEq/L (Figure 5). Notably the highest sweat sodium concentrations(80.37 to 95.76 mEq/L) occurred during training sessions involving running (as opposed to bicycling or plyometrics) at least 90 minutes under humid conditions (75% humidity or greater) and temperatures of 29.4°C, consistent with his self-reports. Testing against standard saline solutions representative of the full range of anticipated sweat sodium concentrations indicates high validity and test-retest reliability testing for both measurement tools. Notably, the average across all session is 10-16 mEq/L higher than the two pilocarpine induced tests, most likely suggesting contamination within the sweat patch sampling method.
In the not too distant past (1950’s-1970’s), it was commonly thought that athletes (and those working in the heat) needed to replace salt lost in sweat to prevent cramps, fatigue, etc. Therefore, salt tablet use was popular (19). However, as the sports drink industry began, the focus shifted to hydration, and, as most sport drinks contain electrolytes, salt tablets long with the recommendation to use them, fell out of use. As athletes began to ingest more fluid and especially to excess, Exercise Associated Hyponatremia (EAH) became not uncommon and has resulted in several deaths in the last 3 decades [20]. More recently (1990’s-2000’s), as the sports nutrition industry has taken hold, electrolyte and/or salt replacement has again seen a rise in popularity while the focus on hydration has diminished very little, especially in the endurance (marathon, ultra-marathon, triathlon, etc.) sport communities. Athletes are often told and often believe that by taking electrolytes, they are preventing EAH, fatigue, muscle cramps, etc. [21].While mathematical models suggest that sodium supplementation may be necessary to prevent EAH [22], it has been repeatedly demonstrated that EAH is largely a state of water intoxication and can be prevented in most individuals by following “drink-to-thirst” guidelines alone without the need for sodium replacement [23]. Plasma volume contraction, however, is a sodium-driven issue for which sodium replacement is an effective preventive or treatment strategy [24]. For example, Anastasiou, et al., demonstrated that when fluid intake matches fluid loss during exercise in the heat, plasma volume contraction is not prevented and concluded that sodium is required to prevent plasma volume contraction [25]. Sims, et al., also reported that sodium supplementation prevents plasma volume contraction and reduces physiologic strain of trained men exercising in the heat [24]. If plasma volume contraction proceeds unchecked, a point will be reached where ongoing losses and the accompanying symptom complex (hypotension, tachycardia, lightheadedness, weakness, confusion, nausea, etc.) compromise continued performance. Simultaneously, if free water ingestion along continues, the individual is at risk for EAH. In these regards, there is a need to develop evidence-based strategies for sodium supplementation, strategies that will likely be useful for endurance athletes, those with cystic fibrosis, and laborers working under conditions of high heat and humidity.
It is argued that sodium supplementation is unnecessary as the process of acclimatization compensates by expanding plasma volume in response to both exercise and heat exposure in humans along with a reduction in sweat sodium and chloride concentration. These changes require 10-14 days of acclimatization to be complete, and, as many age group level athletes travel to different regions to compete, an acclimatization strategy becomes impractical and even impossible for many [26]. Additionally, it is not known if CF athletes acclimatize similarly [8]. One investigation observed that while individuals with CF tolerated exercise in the heat well, they failed to demonstrate a more dilute sweat after eight days of exercise in the heat [27].
There are many challenges for testing under field conditions, and a better understanding is needed of the strengths and limitations of these novel applications and collection materials in order to ensure sufficient accuracy and validity of the data. Comparisons of same samples between the Horiba, Aquacheck, and Sweat Chek Sweat™ Conductivity Analyzer methods is a necessary next step if these costefficient field methods are to be sufficiently validated. Another concern is the potential contamination of the sample collection of sweat via regional patches. Whole-body-wash down (WBW) is considered the most accurate means of determining sweat electrolyte composition and amounts [16] but creates significant logistical issues because of the need to collect all sweat lost. Several studies have demonstrated that regional sweat composition can be used to estimate WBW amounts with reasonable accuracy using regression analyses [16,17]. The collection methods used vary, but while similar, none followed the same procedure utilized in this report. Another necessary future project is measurement of sweat collected by the pilocarpine standard with both the Horiba and the Aquacheck methodology alongside potential sweat collection during exercise with the Macroduct System and analyzing via all three methods. Deficiencies considered, the methods herein are simple, cost-efficient, and demonstrate what is reasonably feasible for an individual when self-testing in the field. These results suggest that further research is justified using this non-traditional, field approach to regional sweat patch construction and sweat collection to ruther establish validity and precision for measurement of sweat sodium across a range of participants.
4. Conclusion
This case report presents innovative methodology for measuring sweat sodium loss in the field that is affordable and simple to use, the pilot ant preliminary findings of which indicate reasonably good agreement between the two methods and against a pilocarpine baseline in a single subject. Prospective, formal, and more controlled research is justified to refine and evaluate these methods in cohorts of endurance athletes, CF affected, and controls. Reasonably valid and reliable field tools for measuring sweat sodium loss are necessary so that individuals will be better equipped toassess their own sweat sodium losses and unique need for sodium replacement during training, competitive events, or even daily laboring. This case is suggestive of the potential that exists for a cost-efficient, validated field tool to assist in providing evidence-based guidelines for sodium supplementation based on sweat sodium values.
Competing Interests
The authors declare that they have no competing interests.