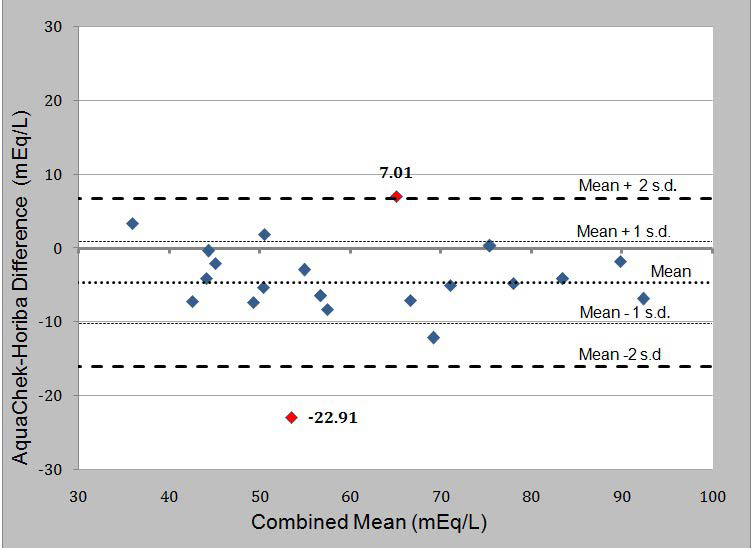
Figure 2:
Bland-Altman Plot of Difference against Mean Sweat [Na+] Concentration (mEq/L) for Aquachek minus Horiba, Left Scapula Site.