


1. Introduction
Generally, knee extension muscle strength is assessed using isokinetic muscle strength measurement devices and is associated with satisfaction with recreational and sporting abilities [1]. The advantage of evaluating muscle strength using an isokinetic muscle strength measurement device is that it provides resistance that is almost equal to the torque output by the participants, so the participant does not receive unreasonable resistance [2], making it possible to measure muscle strength safely and accurately. However, isokinetic muscle torque measurement devices are very expensive and have limited application in terms of measurement location. Isokinetic muscle strength measurement device is not available to all therapists. In recent years, there have been reports of phase angle (PA), estimated using bioelectrical impedance analysis measurements [3], and muscle echo intensity (EI) and muscle thickness (MT), estimated using ultrasound [4], being related to knee extension muscle strength.
The PA is an index that is directly calculated from the measured values by the bioelectrical impedance analysis (BIA) [5] without using estimating equations and is considered to reflect the physiological function at the cellular level [6,7]. The BIA method measures the resistive and capacitive components of a biological tissue's ability to interfere with alternating currents. PA is the difference between the overall current and voltage and indicates the structural integrity (quality) of the cell [8,9]. PA is reported to correlate with isometric knee extensor strength, maximal walking speed, and five-repetition chair stand time in stable chronic obstructive pulmonary disease outpatients [3]. Therefore, PA is expected to play a role as a comprehensive indicator of physical characteristics and motor function. However, the relationship between isokinetic knee extensor strength, PA, and motor function is unclear.
Muscle EI is an established method for evaluating muscle quality using diagnostic ultrasound. Muscle EI is quantified using gray-scale ultrasound, which entails the analysis of 256 grayscale levels from 0 to 255 and correlates with the amount of non-contractile tissue in skeletal muscle [10,11]. This non-invasive and safe method allows easy assessment of the proportion of non-contractile intramuscular elements, with an increase in EI being primarily interpreted as increased amounts of fat and connective tissue [12-14]. A predominantly white appearance suggests that there is a substantial amount of non-contractile tissue in the skeletal muscle, whereas a black appearance suggests that there is little non-contractile tissue [12]. The validity of ultrasound measurements of muscle fiber mass and non-contractile tissues has been proven in comparison studies using magnetic resonance imaging [15,16]. Previous studies have reported associations between isokinetic knee extensor strength and quadriceps muscle EI in healthy young adults [17], and between muscle echo intensity and usual walking speed in the elderly [18]; however, the associations with other motor functions remain unclear. MT is used as an index of muscle mass. Generally, MT is measured by transverse imaging with a probe in perpendicular contact with the muscle fiber. The validity of MT has been demonstrated by its high correlation with actual measurements using cadavers [19,20] and MRI imaging [21,22]. The relationship between isokinetic knee extensor strength and quadriceps MT, and MT and normal walking speed and five-repetition sit-to-stand test has been shown in the elderly [10,23], but the relationship between MT and motor function is unclear.
There is no report of muscle function assessment and motor function measurement in the same participant in healthy young adults. Isokinetic muscle strength measurement device is not available to all therapists. Ultrasound and bioelectrical impedance analysis, which were selected as devices for evaluating muscle function in this study, are simple, quantifiable, and objective. We hypothesized that PA and muscle echo intensity, which are used for qualitative assessment of muscle, were more relevant to motor functions and isokinetic strength than MT, which is used as an index of muscle mass. In participants with impairment, there is a decrease in knee extensor strength, swelling inside and outside the knee joint, and differences in activity. Because we wanted to exclude those biases, we included only young healthy adults in this study. Therefore, the purpose of this study was to examine whether the parameters that can be extracted with ultrasound and BIA can be one of the multifaceted evaluation methods for rehabilitation evaluation, even if the isokinetic muscle strength measurement device cannot be used in the muscle function evaluation of knee extensor strength.
2. Methods
2.1 Study design and participants
This was a cross-sectional study. We recruited healthy young adults from universities and graduate schools to participate by spreading information through university campus posters. The inclusion criteria were healthy young adult volunteers, 18-35 years old, who had not engaged in any regular and systematic training programs in the previous 6 months. The exclusion criteria were as follows: inability to walk without assistive devices and reported history of lower limb trauma or surgery, neuromuscular disorder, or acute or chronic diseases that might have impaired their muscle strength and power; any history of metabolic, hormonal, and cardiovascular diseases; and those taking any medication with an influence on hormonal or neuromuscular metabolism. Participants were informed about the design of the study with specific information on the possible risks and any discomfort related to the procedures that could occur. All participants completed and signed an informed consent form. All study procedures were conducted in accordance with the 1964 Declaration of Helsinki and its later amendments, and the study was approved by the Ethics Committee of Tokyo Metropolitan University Graduate School and Human Health Sciences (No. 20001).
2.2 Measurement of study parameters
2.2.1 Phase angle
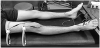
Body composition parameters, including PA, were obtained using a multi-frequency bioelectrical impedance analyzer (Msd-100, TANITA Corp, Tokyo, Japan) and the 4-electrode method. The current applied was 100 μA or less, and the measurement frequencies were 5, 10, 20, 25, 40, 50, 100, 200, 250, and 500 kHz. The current values were in accordance with the standards established by the International Electrotechnical Commission. Disposable electrocardiogram electrodes (RedDot 2330; 3M Japan Ltd., Tokyo, Japan) were used to apply the current by placing them at the centers of the insteps of both feet. The detecting electrode was a belt-type stainless steel plate, 1 cm wide, firmly placed, and then looped around the measurement location, as shown in Figure 1. The thigh and the stainless-steel plate of the electrode were wiped with a damp cloth, and the electrode was brought into contact with the sites 7 cm proximal and 7 cm distal to the midpoint connecting the greater trochanter to the lateral condyle of the femur. The measurement was performed in the supine position, and the right thigh was measured. The participants held their arms and legs to avoid contact with any other body segments during the procedure. According to the recommendations for clinical application of BIA [5], PA at 50 kHz was used for the analysis. The PA was calculated using the equation:
based on Xc (reactance) and R (resistance).
For all measurements, BIA measurements were performed first. To assess test-retest reliability, intra-class correlation coefficients (ICC (1.1)) were evaluated in six male and six female participants with a mean age of 21.5 ± 0.7 and 21.6 ± 0.7 years, respectively. The ICC (1.1) values of PA were 0.97 for both males and females.
2.2.2 Muscle thickness and echo intensity
MT and muscle EI assessments were performed according to a previous study [24,17]. Transverse ultrasound images of the quadriceps femoris muscles (rectus femoris [RF], vastus intermedius [VI], vastus medialis [VM] of the right leg were obtained using a B-mode ultrasound imaging device (Aplio i800; Canon Medical Systems Inc., Tokyo, Japan) and a multi-frequency linear probe (i18LX5; 18 MHz; probe width, 64 mm). All ultrasound images were obtained using the following acquisition parameters: gain, 80 dB; depth, 40 mm. All measurements were performed under the same conditions. Before the measurement, the participants rested in a supine position with their lower limbs relaxed and fully extended for 15 min to allow fluid shifts to stabilize [25]. The probe was positioned perpendicular to the longitudinal axis of the quadriceps femoris muscle. A water-soluble gel was used to provide acoustic contact, and care was taken not to compress the subcutaneous tissue. The probe was fixed at the position where the femur was the whitest and clearest, as depicted on the ultrasound monitor and just below its center. The images of the MT were obtained as the sum of the thicknesses of the RF and VI at the midpoint between the lateral condyle of the femur and the greater trochanter. The EI images were obtained as the muscle EI for the VM at the distal third of a line drawn from the lateral condyle of the femur to the greater trochanter. The ultrasound images were stored in an ultrasound machine for future analyses. Medical image processing, analysis, and visualization software (version 1.48; National Institutes of Health, Bethesda, MD, USA), was used to analyze the images on a personal computer. A rectangular region of interest (ROI), including as much muscle as possible but avoiding the bone and surrounding fascia, was determined for the EI calculation of the muscle. The mean EI of each muscle was determined using a standard histogram gray-scale function and expressed as a value between 0 (black) and 255 (white). The same investigator performed all the calculations. To assess test-retest reliability, intra-class correlation coefficients (ICC (1.1)) were evaluated in six female participants with a mean age of 21.5 ± 0.7 years. The ICC (1.1) values of MT and EI were 0.90 and 0.85, respectively.
2.2.3 Maximum knee extension strength
The maximum knee extension strength was assessed according to a previous study [17]. The maximal isokinetic strength of the knee extensors on the right side was measured using an isokinetic dynamometer (Cybex Norm; CSMi, Computer Sports Medicine Inc., Stoughton, MA, USA). The participants were seated with a hip flexion of 85° (0° being the anatomic position) and the lateral condyle of the right leg aligned with the axis of rotation of the dynamometer. After two practice trials, isokinetic strength (N) was measured for three repetitions, submaximal isokinetic knee extension/flexion repetitions at a velocity of 60°/s; the maximum value was then used. The torque (Nm) was calculated by multiplying the strength (N) by the lever arm (m).
2.2.4 Motor functions
Gait speed assessment was performed according to a previous study [26]. Gait speed was measured in seconds using a stopwatch. The participants were asked to walk on a flat and straight surface. The usual and maximum walking speeds were then measured. Usual meant walking at usual speed and the maximum was as fast as possible and the measurement was performed twice to calculate the average value. Two markers were used to indicate the start and end of a 5m walk path, with a 3 m section to be traversed before passing the start marker, so that participants were already walking by the time they reached the timed path. Participants were asked to continue walking for an additional 3 m past the end of the path to ensure a consistent walking pace while on the timed path. The time measurement started when the trunk crossed the start line of the measurement section and ended when the trunk crossed the goal line.
The five-repetition sit to stand test (5STS) was performed according to a previous study [27]. Measurements were taken using a platform with a seat height of 40 cm from the floor without a backrest and armrests. Seated participants were asked to move forward on the chair seat until the feet were flat on the floor and to fold their upper limbs across the chest. Participants were then instructed to stand up all the way and sit down once without using their upper limbs. For those unable to complete the initial maneuver or who required assistance, the test was terminated. If successful on the initial sit to stand, participants were then asked to stand up all the way and sit down landing firmly, as fast as possible, five times without using the arms. Timing with a stopwatch was started when the buttocks got out of the seat and stopped at the fifth upright posture; the time taken was recorded as the participant’s score.
The stand-up test was performed according to a previous study [28]. This test assesses the participants’ leg strength by having them stand up, using one or both legs, from a specified height, and maintaining their posture. Participants were requested to stand from four different height platforms (10, 20, 30, and 40 cm) with one or both legs. If a subject succeeded in standing up and maintaining that posture for 3 s, the trial was judged as complete. Participants were allocated a score of 0-8 based on their performance, and a score of 0 was given when the participants were unable to stand from a platform of 40 cm with both legs, and a score of 8 was given when it was able to stand from a platform of 10 cm with one leg. Higher scores indicated a better ability to stand up.
2.3 Statistical analysis
The Shapiro-Wilk normality test was used to verify the distribution of data. The stand-up score is reported as median (25, 75 percentile), and all other values are reported as mean ± standard deviation (SD). The Pearson product-moment correlation test was used to investigate possible associations between the parametric parameters analyzed. For nonparametric data, the Spearman rank correlation test was used. Statistical significance was defined as a p-value < 0.05. Since males are larger than females, for the PA, muscle EI, MT, and maximum torque during isokinetic knee extension at 60°/s, all analyses were performed by sex. Statistical analysis was performed using SPSS Statistics for Windows, version 26.0, (IBM Corp., Armonk, NY, USA).
3. Results
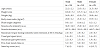
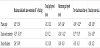
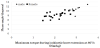
Thirty-three participants (mean age ± SD, 22.2 ± 2.2 years; range, 20–32) were included in this study. The study participants included 12 males and 21 females. Their baseline physical characteristics and study parameters measurements are shown in Table 1. The correlation coefficients between PA, muscle EI, MT, and motor function are summarized in Table 2. Both males and females showed a significant correlation between maximum torque during isokinetic knee extensor strength and PA (males, r = 0.65, p = 0.02, females, r = 0.54, p = 0.02) (Figure 2), muscle EI (males, r = -0.53, p = 0.03, females, r = -0.54, p = 0.009), and MT (males, r = 0.34, p = 0.03, females, r = 0.38, p = 0.03). In addition, significant correlations between PA and maximum gait speed (males, r = 0.64, p = 0.02; females, r = 0.44, p = 0.04), 5STS (males, r = -0.69, p = 0.02, females, r = -0.62, p = 0.008), and stand-up score (females, r = 0.45, p = 0.03) were found. Significant correlations were also observed between muscle EI and maximum gait speed (males, r = -0.34, p = 0.04; females, r = -0.42, p = 0.04), 5STS (males, r = 0.37, p = 0.009; females, r = 0.33, p = 0.02), and stand-up score (females, r = -0.30, p = 0.03). In contrast, MT did not correlate with any motor function.
4. Discussion
In this study of 33 healthy young adults, both sexes showed a significant correlation between maximum torque during isokinetic knee extensor strength and PA, muscle EI, and MT. In addition, a significant correlation was found between PA as well as muscle EI and maximum gait speed, 5STS, and stand-up scores. In contrast, MT did not correlate with any motor function.
While the correlation coefficients were highest between PA and knee extensor strength, it was lowest between MT and knee extensor strength. No previous studies were found for the relationship between PA and isokinetic knee extensor strength in healthy individuals; however, the correlation coefficient between PA and isokinetic muscle strength in chronic obstructive pulmonary disease patients was reported to be 0.66 [3], which is similar to the results of our study. In a report of muscle EI and MT in isometric strength in young adults, no significant correlation was found for muscle EI, while the correlation coefficient for MT was 0.63 [29]. Moreover, the correlation coefficients for isometric strength in the elderly showed no significant correlation for EI and 0.48 for MT [29]. In another report, muscle EI was -0.33 and MT was 0.41 in isometric strength in the elderly. The results of the present study and those of the previous studies showed variability. This could be due to the differences in the measurement positions, target muscles, and muscle contraction types. With regard to the characteristics of the parameters, MT is used as a quantitative method of assessing muscle [19,22]; however, it has been shown that MT also includes connective and adipose tissues [30]. Moreover, the loss of muscle mass alone can only partially explain muscle weakness [31]. In contrast, PA indicates the structural integrity of the cells [8,9], and muscle EI can distinguish connective tissue and adipose tissue [12], allowing for a qualitative assessment of muscle. However, it has been reported that PA and muscle EI are affected by the water content of the body, specifically the extracellular water molecules relative to the muscle volume because of their measurement principles [32,33]. Therefore, the parameters PA, muscle EI, and MT in muscle strength evaluation were found to be related, and while the qualitative evaluation method of muscle may be more useful, the correlation coefficients may differ depending on the measurement method and conditions. Therefore, careful interpretation of the data is necessary.
In the present study, PA and muscle EI were significantly correlated with maximal gait speed and the 5STS in males and females, and with the stand-up score in females. In a previous study, the change in PA due to resistance training was reported to have a significant positive correlation with the change in muscle quality (muscle strength per unit skeletal muscle mass) [34]. In addition, a study comparing PA in underweight anorexia nervosa (AN) patients, thin individuals, and ballet dancers reported that patients with AN had lower PA than other participants [35], suggesting that there are fewer normal cells with cell membranes of high structural integrity. Another study compared the changes in MT, muscle EI, and motor function in patients with hip osteoarthritis who underwent strength training at high and low velocities [36]. The results showed an improvement in one of the motor functions and greater muscle EI of the gluteus maximus in the high-velocity group and no significant difference in the changes of other outcome measures between the two groups. In contrast, MT showed no association with any of the motor functions. MT does not represent the cross-sectional area of the entire muscle, but only a portion of it. A previous study that examined the relationship between the change in MT and electromyographic activity in the oblique and transversus abdominis muscles, Hodges et al. [37] described a non-linear relationship, while another study [38] reported that there was no relationship. Considering the above, it can be inferred that PA and muscle EI, which allow qualitative assessment of muscle structural integrity and the amount of non-contractile tissue, could reflect fewer changes in motor function, and were more strongly related to motor function than MT. In terms of usual gait speed, previous studies on PA and muscle EI and usual gait speed found no correlation. It should be noted that the subjects in these studies were elderly [18,39] whereas the healthy young adults in the present study had larger absolute muscle mass. In the stand-up score, 10 out of the 12 males had the highest score, indicating a ceiling effect. Extension of the trunk, hip, knee, and ankle joints occurs during the extension phase of the standing movement [40]. In addition, it is thought that standing up from a low floor requires not only knee extension muscle strength but also combined extension muscle strength of the trunk and lower limbs, thus, it is inferred that young adult males, who generally have more body muscle mass, have a higher complementary function of antigravity movement besides the knee extension movement. On the other hand, elderly people and young adult females have less muscle mass and less complementary function of antigravity movement other than knee extension movement. Therefore, PA and muscle EI in this study were correlated with the stand-up score in females, but not in males.
Our study had some limitations. First, the sample size for this study is small. If the sample size is small and the power of the test is low and no significant difference can be obtained, there are concerns about the possibility of Type 2 error. Therefore, for some motor functions that do not correlate with muscle functions assessment parameters, the sample size needs to be reexamined in the future. Moreover, the parameters obtained by ultrasound and BIA do not directly represent knee extensor strength and motor function. This parameter is only one tool in a multifaceted method of rehabilitation evaluation. Second, it is unclear whether it is possible to accurately measure PA, which has been found to be highly relevant in postoperative knee patients because they often have metal around the knee joint. Third, it is unclear to what extent the values of parameters such as PA are affected by differences in limb position and muscle contraction style during measurement. Third, although the maximum torque of the knee joint is an important factor for the 5STS of the motor function measured in this study, we believe that agility is also necessary. It is conceivable that data obtained from a setting with a faster angular velocity may have yielded results that are more relevant to the 5STS. In contrast, exercises where the angular velocity of the knee joint is considered to be slower than 60 degrees/second, such as the stand-up score and isometric muscle strength, may provide more relevant results. Finally, since this was a cross-sectional study, causality could not be established, and it is necessary to examine the effects of parameters on muscle strength and motor function longitudinally in the future.
5. Conclusions
In conclusion, we found that even if the isokinetic muscle strength measurement device cannot be used to evaluate the muscle function of knee extensor strength, the parameters obtained by ultrasound and BIA can be used one multifaceted evaluation approach for rehabilitation in healthy young adults. PA, muscle EI, and MT, in that order, were significantly associated with isokinetic knee extensor strength, and only PA and muscle EI were associated with motor function. The study concludes that a qualitative muscle assessment method could provide a simpler and more multifaceted assessment of muscle strength in healthy young adults.
Competing Interests
The authors declare that they have no competing interests.
Author Contributions
Design of the study: Tomoyuki Yamauchi and Takumi Yamada.
Analyzed the data: Tomoyuki Yamauchi and Takumi Yamada.
Wrote the first draft of the manuscript: Tomoyuki Yamauchi.
Continued writing the manuscript: Tomoyuki Yamauchi.
Contributed to the writing of the manuscript: Tomoyuki Yamauchi
and Takumi Yamada.
Agree with manuscript results and conclusions: Tomoyuki Yamauchi
and Takumi Yamada.
Structure and arguments for the paper: Tomoyuki Yamauchi and
Takumi Yamada.
Made critical revisions and approved final version: Tomoyuki
Yamauchi and Takumi Yamada.
All authors reviewed and approved of the final manuscript.
Acknowledgments
We would like to express our gratitude to all the subjects who participated in this study.