


1. Background
Muscle mass declines in old age, and low muscle mass is related to low physical functions (balance and walking speed) and decreased ability to perform activities of daily living (ADLs) and instrumental ADLs (IADLs) [1-3]. Besides, the muscle tissue thickness at the front area of the thigh particularly tends to decrease with age after twenties [4]. Older women who have higher thigh muscle volumes had faster gait speeds (m/s) and stronger muscle power [5]. The power of muscles such as the quadriceps is associated with the ability to perform ADLs and IADLs in old age [6,7]. Moreover, the prevalence of malnutrition in hospitalized individuals is higher than that in community-dwelling individuals, and malnutrition is related to low muscle mass [8,9]. Thus, comprehending the muscle mass in the femur region, which comprises the quadriceps, is of importance for older adults, especially in hospitalized ones.
To evaluate the muscle mass of the femur region, magnetic resonance imaging, computed tomography, and ultrasound, among others, are used. However, these modalities are expensive and take time and effort to measure. The circumference reflecting muscle mass [10,11] can be easily measured using only a tape measure, which is inexpensive. Therefore, circumference measurement is a useful method to easily and cheaply assess muscle mass in hospitalized older adults in clinical settings.
Thigh circumference (TC) that measures the muscle mass of the femur region is assessed with the knee joint extended [12], and we typically use platforms or beds for measuring TC in clinical settings. We often experience a lack or not enough platforms or beds nearby due to the size and structure of the facilities. TC could be measured easier and more versatile if we measure the TC with the knee joint flexed, that is, in the sitting position. However, few studies have reported on whether TC measurement in the sitting position (knee joint flexed) is associated with that in the supine position (knee joint extended) in hospitalized older adults. Determining the relationships between TC measurement in the sitting position and that in the supine position could provide more opportunities for evaluating the muscle mass of the femur region, thus helping prevent the decline of the ability to perform ADLs or IADLs of hospitalized older adults. This study clarifies the association between TC measurements in the sitting position with those in the supine position in hospitalized older adults.
2. Materials and Method
2.1 Participants
Sixty-seven hospitalized elderly patients (average age ± standard deviation [SD]: 83.5 ± 7.6 years [range, 67-98 years]) were recruited in this cross-sectional study in Toyoda Eisei Hospital. The exclusion criteria were as follows: 1) patients who could not provide consent and 2) those who could not be completely measured. The average duration from the date of onset of the primary diseases was 30.1 ± 27.6 days. The primary diseases of the patients comprised orthopedic diseases (femur fracture, 32.8% (n = 22); spinal compression fracture, 22.4% (n = 15); pelvic fracture, 4.5% (n = 3); patellar or leg fracture, 3.0% (n = 2); and cervical fracture, 3.0% (n = 2); total, 65.7%), cardiovascular diseases (stroke, 20.9% (n = 14); and acute subdural hemorrhage, 1.5% (n = 1); total, 22.4%), and others (disuse syndrome, 6.0% (n = 4); Guillain–Barre syndrome, 1.5% (n = 1); meningioma, 1.5% (n = 1), central cervical spinal cord injury, 1.5% (n = 1); and Parkinson syndrome, 1.5% (n = 1); total 12.0%. Each participant read and signed an informed consent form, and this study was approved by the ethics committee of Health Science University.
2.2 TC
TC was measured from two proximal points (10 cm and 15 cm from the patella on the edge) in the supine position with the knee joint extended and in the sitting position with the hip and knee joints approximately 90° flexed (the sole is on the floor). Each measurement of TC was performed twice at both sides (left and right) to the nearest 0.1 cm using a tape measure. The good to perfect inter-observer and intra-observer reliability to measure leg circumferences were observed in a previous study [13]. The average values of the two measurements were used for analysis. The TC measurements of the proximal point 5 cm from the patella on the edge were excluded because they had an observed overlap between them and the muscle belly of the triceps surae in the sitting position.
2.3 Barthel index (BI)
The ability to perform ADLs was evaluated using the BI [14]. The BI is based on the following 10 items (total score ranged from 0 to 100 points): eating (0, 5, or 10 points), getting on and off the toilet (0, 5, or 10 points), moving from a wheelchair to a bed and back (0, 5, 10, or 15 points), walking (0, 5, 10, or 15 points), ascending and descending stairs (0, 5, or 10 points), dressing (0, 5, or 10 points), grooming activity (0 or 5 points), bathing (0 or 5 points), bowel control (0, 5, or 10 points), and bladder control (0, 5, or 10 points). The lower the points are, the more assistance in performing ADLs is needed.
2.4 Statistical analysis
The characteristics of the patients enrolled in this study are presented as mean ± SD. Statistical assessment was conducted using JMP 11 (SAS Institute Inc., Cary, NC, USA) and R3.6.3 (CRAN, freeware). Normal distributions of the following TC values-supine left (SUL), 10 cm; sitting left (STL), 10 cm; supine left (SUL), 15 cm; sitting left (STL), 15 cm; supine right (SUR), 10 cm; sitting right (STR), 10 cm; supine right (SUR), 15 cm; and sitting right (STR), 15 cm-were confirmed using the Shapiro–Wilk test. The associations between SUL (10 cm) and STL (10 cm), SUL (15 cm) and STL (15 cm), SUR (10 cm) and STR (10 cm), and SUR (15 cm) and STR (15 cm) were evaluated using Pearson’s product moment correlation coefficient. Moreover, the agreements between SUL (10 cm) and STL (10 cm), SUL (15 cm) and STL (15 cm), SUR (10 cm) and STR (10 cm), and SUR (15 cm) and STR (15 cm) were estimated using the Bland–Altman analysis [15-17]. P values of < 0.05 were used to denote statistical significance.
3. Results
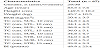
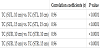
Table 1 shows the general characteristics of the patients enrolled in this study. All TC values (SUL [10 cm], STL [10 cm], SUL [15 cm], STL [15 cm], SUR [10 cm], STR [10 cm], SUR [15 cm], and STR [15 cm]) had normal distributions according to the Shapiro-Wilk test. Strong correlation coefficients were found between SUL, STL, SUR, and STR using Pearson’s product moment correlation coefficient (SUL [10 cm] vs. STL [10 cm]: r = 0.96; SUL [15 cm] vs. STL [15 cm]: r = 0.96; SUR [10 cm] vs. STR [10 cm]: r = 0.96; SUR [15 cm] vs. STR [15 cm]: r = 0.96; all p < 0.05) (Table 2).
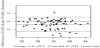
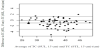
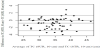
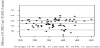
In regard to 95% confidence intervals (CI) between SUL (10 cm) and STL (10 cm), SUL (15 cm) and STL (15 cm), SUR (10 cm) and STR (10 cm), and SUR (15 cm) and STR (15 cm), systematic biases were all observed using the Bland-Altman analysis (SUL [10 cm] and STL [10 cm]: mean difference, -0.72; 95% CI, -1.01 to -0.44; limits of agreement, -2.52 to 1.08; SUL [15 cm] and STL [15 cm]: mean difference, -0.98; 95% CI, -1.31 to -0.64; limits of agreement, -3.10 to 1.14; SUR [10 cm] and STR [10 cm]: mean difference, -0.83; 95% CI, -1.16 to -0.49; limits of agreement, -2.96 to 1.31; SUR [15 cm] and STR [15 cm]: mean difference, -1.07; 95% CI, -1.45 to -0.69; limits of agreement, -3.48 to 1.34; all p < 0.05) (Figure 1-4). Alternatively, no significant relationships were observed between SUL (10 cm) and STL (10 cm) (p = 0.28), SUL (15 cm) and STL (15 cm) (p = 0.33), SUR (10 cm) and STR (10 cm) (p = 0.61), SUR (15 cm) and STR (15 cm) (p = 0.65) using the Bland–Altman analysis, respectively (Figure 1-4).
4. Discussion
Strong correlations between the TC values in the supine position and those in the sitting position were observed in this study. With regard to the 95% CI of the mean differences between SUL (10 cm) and STL (10 cm), SUL (15 cm) and STL (15 cm), SUR (10 cm) and STR (10 cm), and SUR (15 cm) and STR (15 cm), systematic biases were found between all TC values with changes in posture using the Bland-Altman analysis in this study. An error occurring in a specific direction regardless of the true value is a systematic bias [17].
In this study, the mean differences between TC values in the supine position and those in the sitting position were -0.72 between SUL (10 cm) and STL (10 cm), -0.98 between SUL (15 cm) and STL (15 cm), -0.83 between SUR (10 cm) and STR (10 cm), and -1.07 between SUR (15 cm) and STR (15 cm). The proportions of the patients who had smaller TC values in the sitting position than those in the supine position were 67.2% for SUL (10 cm) versus STL (10 cm) (n, 45 / 67, respectively), 76.1% for SUL (15 cm) versus STL (15 cm) (n, 51 / 67, respectively), 64.2% for SUR (10 cm) versus STR (10 cm) (n, 43 / 67, respectively), and 68.7% for SUR (15 cm) versus STR (15 cm) (n, 46 / 67, respectively). It has been reported that the pennation angle of vastus lateralis muscle increases with knee extension [18]. The pennation angle is positively associated with the muscle thickness [19]. Therefore, the TC values in the sitting position may be underestimated compared with those in the supine position.
Furthermore, Beker et al. (2017) have reported that the average circumference values (the widest point for the gastrocnemius) using a standard, nonelastic bendable tape at the first and second times in six observers were 35.79 cm and 35.65 cm, respectively; 35.84 cm and 35.64 cm, respectively; 35.72 cm and 35.64 cm, respectively; 35.84 cm and 35.71 cm, respectively; 35.37 cm and 35.18 cm, respectively; and 35.81 cm and 35.70 cm, respectively [13], and the differences in the average values at the first and second times in six observers approximately ranged from 0.08 to 0.20 cm. Moreover, the difference between the TC values at the 10-cm part of the knee joint space in the test–retest measurement was 0.9 ± 0.7 cm [20]. The range of the mean differences was from -0.72 to -1.07 cm, and the limits of agreement were -2.52 to -1.08 between SUL (10 cm) and STL (10 cm), -3.10 to 1.14 between SUL (15 cm) and STL (15 cm), -2.96 to 1.31 between SUR (10 cm) and STR (10 cm), and -3.48 to 1.34 for SUR (15 cm) and STR (15 cm) in this study. Thus, we should recognize the possibility that measurement errors occur when measuring the circumferences of 10 cm and 15 cm parts of the thigh in the sitting position.
This study had some limitations. The date of onset of the primary diseases was limited in the patients enrolled in this study, and our results could not be applied to heal thy older adults in the community, or younger individuals. Furthermore, we did not measure the factors that make a difference in the TC values due to changes in posture, and clarifying these factors in future studies may help reduce errors when measuring TC.
5. Conclusions
The TC values (10 cm and 15 cm parts) in the supine position had strong positive associations with those in the sitting position in this study. Alternatively, systematic biases were observed in two methods using the Bland-Altman analysis. We may need to recognize that errors occur when measuring the circumferences of the 10 cm and 15 cm parts of the thigh in the sitting position compared with those in the supine position in hospitalized older adults.
Competing Interests
The authors declare that they have no competing interests.