


1. Introduction
The proportion of people aged 65 years or older has been increasing worldwide, and the Cabinet Office, Government of Japan has estimated that by 2065, 38.4% of the total population of Japan will be aged above 65 years [1]. Aging is associated with a decline in physical function and, in some cases, onset of frailty, a condition of enhanced vulnerability to stressors that can result in adverse health outcomes and dependency on others [2,3]. Therefore, preventing the deterioration in the ability to perform activities of daily living (ADL) to extend healthy life expectancy of elderly people is of substantial benefit.
A deterioration of muscle strength can lead to disability and dependency [3]. Previous studies have typically focused on the aspects of maintaining or improving an individual’s ability to perform ADLs related to the muscle strength of the lower extremities (such as gait or climbing stairs), which are commonly affected by aging. However, elderly people may also need assistance with ADLs that involve their hands or upper extremities, including those requiring fine motor skills. Pinch strength (PS) is associated with the ability to perform ADLs, and a decline in PS can make it difficult for individuals to perform tasks that require fine motor skills, such as fastening buttons or tying shoelaces [4,5,6]. PS decreases in old age [4], and it is important to prevent this deterioration to preserve an individual’s fine motor ability which is one of the factors that affect ADLs.
Muscle strength is positively related to muscular cross-sectional area and muscle mass [7,8]. Conversely, it has been reported that changes in muscle mass and muscle strength do not always correspond [9]. To measure muscle mass using bioelectrical impedance analysis (BIA) is relatively easy and inexpensive compared with other methods, such as computed tomography (CT), magnetic resonance imaging (MRI), and dual-energy X-ray absorptiometry (DXA). However, there has been little investigation of how upper extremity muscle mass (UMM) using BIA influences PS. Clarification of the association between UMM and PS could be useful for suggesting the need to focus on UMM for maintaining or improving PS, especially in elderly; this might eventually lead the maintenance of an individual’s fine motor skills and independence in ADLs and make it possible to evaluate muscle mass more easily.
The aim of this study was first to investigate the relationship between UMM using BIA and PS in healthy young men and women with less impact of muscle atrophy by disease. In addition, we examined the association between upper extremity fat mass (UFM) and PS.
2. Methods
2.1 Participants
This cross-sectional study initially included 85 healthy young men and women aged 20-22 years. Two exclusion criteria were applied: anyone with a pacemaker and/or metal implant placed by surgery; and anyone who had undertaken ≥30 minutes of physical exercise regularly at least twice a week for the previous year [10]. Two people were excluded because of having a metal implant and one because of an exercise habit. Thus, 82 participants (48 men and 34 women) were included in the analysis. Of them, 74 (90%) participants showed right hand dominance; 6 men and 2 women were left-handed. The study was approved by the ethics committee of Health Science University, and all the participants read and signed an informed consent form.
2.2 Pinch strength
Maximum lateral PS was measured three times on each side with a digital pinch sensor (Isoforce GT-300, OG GIKEN, Okayama, Japan). The output range of the pinch force was 0.3-10.2 kgf. The method was as described in previous reports [11,12]: with the participant in a standing position, the measurements were made with the shoulder adducted, the elbow in 90° flexion, and the forearm in a neutral position. The participant grasped the pinch sensor between the pulp of the thumb and the radial side of the distal interphalangeal joint of the index finger. The maximum left and right PS values were used as a representative value.
2.3 Upper extremity muscle and fat mass
The left and right UMM and the left and right UFM were estimated by segmental multifrequency BIA at 5, 50 and 250 Hz using an ioi353S system (Owa Corporation, Tokyo, Japan). BIA has been reported to provide a reliable and valid method for estimating both muscle and fat mass [13,14]. The participant stood barefoot on the device to measure his or her body weight. After the participant’s age, sex, and height were entered into the system, the participant gripped the handles and positioned both palms and the soles of both feet so they were in constant contact with the electrodes for the estimation of UMM and UFM.
2.4 Statistical analysis
The data are presented as means ± standard deviations. The statistical analyses were performed with JMP 11 software (SAS Institute Inc., Cary, NC, USA). Unpaired t-tests were used to evaluate differences in UMM, UFM, and PS between the sexes, and relationships between UMM, UFM, and PS were assessed by Pearson’s correlation analysis. Where there were significant differences in PS between men and women, multiple regression analysis adjusted for sex was used to assess the influence of UMM or UFM on PS. Statistical significance was set at P < 0.05.
3. Results
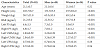
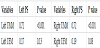
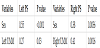
Table1 presents a comparison of participant characteristics between the men and women. There were no significant differences in age or left and right UFM (all P > 0.05), whereas height, weight, body mass index, left and right UMM, and left and right PS were higher in the men than the women (all P < 0.001). Table 2 shows the results of the Pearson’s correlation analyses. There was a significant positive correlation between left PS and left UMM (r = 072, P < 0.001; Figure 1A) but not left UFM (r = 0.17, P = 0.13; Figure 1B). Similarly, there was a significant positive correlation between right PS and right UMM (r = 0.72, P < 0.001; Figure 1C) but not right UFM (r = 0.19, P = 0.08, Figure 1D). Multiple regression analysis adjusted for sex showed that left and right UMM were statistically significant explanatory variables for left and right PS, respectively (P < 0.05; Table 3).

4. Discussion
In this study, UMM but not UFM using BIA was positively related to PS in healthy men and women. UMM was also a statistically significant independent explanatory variable for PS in the multiple regression analysis adjusted for sex. These findings would help in recommending the need to focus on UMM for maintaining or improving PS, especially in elderly, thereby allowing an individual to retain their independence in performing ADLs that involve the fine motor skills of the hands, such as fastening buttons or tying shoelaces and make it possible to evaluate muscle mass more easily.
In this study, the mean values of right and left PS were 7.8 and 7.3 kgf in men and 5.4 and 5.0kgf in women, respectively. The mean values of right and left PS reported in a previous study of healthy Japanese subjects aged 21-39 years were higher than those in the present study: 11.5 and 10.7 kg for men and 7.9 and 7.6 kg for women, respectively [12]. According to Ministry of Health, Labour and Welfare in Japan (2015), the mean height and weight of Japanese people aged 20 years are 173.2 cm and 64.6 kg for men and 156.4 cm and 50.0 kg for women, respectively [15]; the mean height and weight of the participants in this study were consistent with those for the general population. The lower PS values in this study may therefore be the result of differences in equipment and methods, or a greater age range in the previous study. Further studies are needed to correspond with the methods of measurements and characteristics of subjects.
In this study, there was a significant positive association between UMM and PS. Muscle strength depends on the muscular crosssectional area and muscle mass [7,8], so UMM might have an impact on PS. Conversely, the values for the standardized partial regression coefficients for the associations between left and right UMM and PS were 0.27 and 0.41, respectively. The level of muscle exertion is affected not only by muscle mass but also by aspects of the nervous system (such as motor unit recruitment) [16], and there are variations between individuals in the relationship between muscular crosssectional area and muscle strength [17]. The standardized partial regression coefficients of UMM for PS were relatively low in this study. However, effects of the nervous system were not measured. Associations between the nervous system and muscle mass should be clarified in future studies.
Sex was a significant independent explanatory variable for PS in the multiple regression analysis in the present study. Muscle strength is positively associated with muscular cross-sectional area and muscle mass [7,8]. On the other hand, muscle strength per muscular crosssectional area is not significantly different between the sexes [18]. In the present study, no significant differences in the average values of PS/UMM were observed in both left and right sides between the sexes [left (men vs women): 2.3± 0.37 vs 2.2 ± 0.47 ; right (men vs women): 2.4 ± 0.41 vs 2.4 ± 0.40, all P > 0.05]. PS in men was significantly higher compared with that in women and sex may be extracted as a significant independent explanatory variable for PS in multiple regression analysis. The standardized partial regression coefficient between PS and UMM in the multiple regression analysis adjusted for sex was also higher for the right side than the left side. Sex had a stronger impact on left PS in this study. Japanese women typically use both hands for ADLs, such as cooking and applying make-up. Muscle strength is affected by the nervous system [16] and there is not always a linear association between muscle strength and muscle mass [19]. This may explain the greater mismatch between PS and muscle mass in women than in men in this study.
This study had several limitations. The number of participants was small, with little variation in characteristics, and the study included only healthy men and women. Future studies with more participants and a wider range of characteristics (such as including communitydwelling elderly people) are needed. In addition, UMM and UFM were not localized to specific muscles in this study. Further studies are needed to elucidate the association between site-specific muscle mass and PS.
5. Conclusions
PS showed a significant positive association with UMM but not with UFM using BIA. UMM was also a significant independent explanatory variable for PS in multiple regression analysis. This finding could be useful in recommending the need to focus on UMM for maintaining or improving PS and make it possible to evaluate muscle mass more easily.
Competing Interests
The author declare that there is no competing interests regarding the publication of this article.