


1. Introduction
Pain and abnormal sensory function are common problems that affect most patients with neuropathy. Quantitative assessment for these problems is essential for physical therapy. A good measurement method as outcome measure is needed. Thermal quantitative sensory testing (QST) assesses the function of the small peripheral sensory nerves (Aδ and C fibers), which contribute to perception of warmth, cold, and pain [1,2]. Several measurement methods and testing parameters have been reported for thermal QST [3,4]. The most common measurement methods are method of limits (MLI) and method of level (MLE). Yarnitsky and Sprecher measured the thresholds for warm and cold sensation at the thenar eminence and dorsum of the foot, and reported that the reliability of QST by MLE was better than with the MLI [4]. However, Moloney et al. reviewed the studies of thermal QSTs and reported no observable difference in reliability between the MLI and MLE [5].
The Cold Detection Threshold (CDT) and Warm Detection Threshold (WDT) are used for measuring the perception of the thermal thresholds, and researchers have evaluated the reliability of the MLI and MLE [4-9].The Cold Pain Threshold (CPT) and Heat Pain Threshold (HPT) are used for measuring the perception of pain threshold, however, to our best knowledge, no studies have yet compared the reliability of the MLI and MLE.
A review of thermal QST reliability studies reveals that most examined only one measurement method, either the MLI or the MLE. Applying the two methods of thermal QST to the same subject would be a better way to compare the reliability of the two measurement methods. The statistical methods used in thermal QST studies vary greatly, and as a result make comparisons and conclusions very difficult. Wylde et al. have studied the MLI (WDT, CDT and HPT) in knee osteoarthritis and healthy participants with two different statistical analyses, and found these tests had different reliability, ranging from low to high [10]. Sand et al. have studied the MLI (HPT and CPT) in patients with migraine and healthy with coefficient of repeatability statistical analysis, and found the reliability of the HPT was better than the reliability of the CPT [11]. For CPT and HPT testing parameters, only the reliability by MLI has been examined; however, there is no report for MLE.
The purpose of this study, therefore, was to assess the reliability of four types of thermal QSTs by using two measurement methods, the MLI and MLE. In order to provide valuable information for clinical application, both the relative and the absolute reliability were investigated.
2. Methods
2.1 Participants
Twenty-eight healthy young adults (14 females and 14 males) participated in this study. The mean age of participants was 21.6±2.4 years (range: 18-28 years). The inclusion criteria included healthy adults who did not have chronic diseases, such as diabetes, hypertension, or neuropathy. Subjects were also excluded if they were pregnant, had experienced an arm injury within one month, had poor cognition and were unable to cooperate for the tests.
Participants were asked to avoid alcohol consumption and intense exercise for 24 hours before the test, but light activities were permitted. All participants denied having any pain problems and reported good sleep quality the night before the test. The study was approved by the Institutional Review Board of Kaohsiung Medical University Hospital, and written informed consent was obtained from all participants.
2.2 Procedures
The tests were performed in a quiet room with the room temperature maintained at 22°C to 24°C. First, participants rested for 15 minutes before the examiner demonstrating the tests. Second, participants familiarized with the test procedure. Finally, the test were perform.
Thermal QST was performed using a TSA 2001-II machine (Medoc Inc, Ramat Yishai, Israel). A single well-trained technician explained and performed all tests. Participants were familiarized with the procedure by having the test demonstrated on their right forearm; a Peltier thermode (9 cm2) was placed on the middle of the volar side. They were informed about how to respond correctly for each testing parameter. The test was performed on the left forearm; a Peltier thermode (9 cm2) was placed on the middle of the volar side. During the tests, the subjects could not see the change of temperatures on the computer screen. Participants were tested for the CDT, WDT, CPT, and HPT with the MLI and the MLE. The MLI was performed first, followed by the MLE. After finishing the MLI, participants rested for 10 minutes, and then were tested with the MLE. After one week, all participants were retested using the same procedures.
In the MLI, the baseline temperature of each test was set at 32°C, and the ramped temperature on the CDT, WDT, CPT, and HPT was set at 1°C/second. The cut-off temperatures were 0°C and 50°C. The intensity of stimuli was increased until the subjects perceived specific thermal changes or pain, at which time they pressed a button with their right hand (Figure 1). The instructions for the CDT/WDT tests were, “Once you feel cold/warm, press the button.” For CPT/HPT testing, subjects were instructed, “When you feel cold/warm at the place that you feel a little bit uncomfortable, press the button.” The CDT and WDT were tested first, followed by the CPT and HPT. The CDT and WDT were measured four trials, and the CPT and HPT were measured three trials. After recording the temperature of each trial, the mean values of all trials were calculated [3].
In the MLE, the baseline temperature of each test was set at 32°C, the temperature was changed and participants were asked to respond YES or NO, depending on whether or not they perceived specific thermal or pain sensations [4]. The initial temperature step of 4°C was set, and the temperature returned to 32°C immediately after termination of each stimulus. A YES response led to a smaller stimulus, while a NO response led to a larger stimulus. Magnitude of change was determined by the previous stimulus–step magnitude being halved as turns of direction, or unchanged for no alteration in direction. Thus, if a specific stimulus had a similar response to the previous one (NO-NO or YES-YES), the step magnitude for the following stimulus was unchanged, while for a different response (NO-YES or YES-NO), the next step was halved. The stimuli were continued until step magnitude reached 0.2°C and the number of trials was recorded (Figure 2). Threshold of thermal or pain sensation was the average of stimuli temperature for the last YES stimulus and the last NO stimulus. CDT and WDT were tested first, followed by CPT and HPT.
2.3 Data management and Statistical Analyses
All statistical analyses were performed with SPSS 18.0 for Windows (IBM Corp, Armonk, NY, USA). Descriptive analyses were used for CDT, WDT, CPT and HPT. Student’s t-tests were used for comparison of gender differences. The number of trial of MLE was record. Intraclass correlation coefficients (ICCs) were used to estimate relative reliability. The ICC was calculated as the ratio of the variance between subjects and the total variance. Absolute reliability was estimate by a series of statistical procedures. The standard error of measurement (SEM) and smallest real difference (SRD) were used to estimate absolute reliability.
Equation 1: SEM = (standard deviation of all test-retest values) x√(1- ICC) Equation 2: SRD = 1.96 x SEM x √2
3. Results
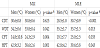
Overall, women detected temperature changes and thermal pain earlier than did men (Table 1). The most marked differences reported between the men and women involved the CPT and HPT; the mean temperature of CPT for women was at about 25°C, while for men, the mean temperature was below 20°C; the mean temperature of HPT for women was about at 39°C, while for men the mean temperature was about 43°C. The mean temperature of WDT for women (33.8 and 33.7°C for MLI and MLE, respectively) was slight lower than the temperature for men (34.2 and 33.8 °C for MLI and MLE, respectively) for women (p = 0.042 and 0.013 for MLI and MLE, respectively).
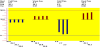
The number of trials of the MLI was fixed (3 trials for CPT/HPT and 4 trials for CDT/WDT); in contrast, the number of trials of the MLE depended on the responses of the participants. Figure 1 shows the CDT, WDT, CPT, and HPT record measured by MLI of one participant. The mean temperature of CDT was 26.1°C (26.0, 26.2, 26.2, and 26.0°C for first, second, third, and fourth trials, respectively) Similarly, the mean temperature of WDT was 38.7°C (38.8, 38.2, 38.8, and 38.8 °C for first, second, third, and fourth trials, respectively). The mean temperature of three trials of CPT and HPT was 4.3°C and 45.3°C, respectively.
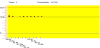
The number of trials performed was often greater than 10 (range: 6 to 27 trials) for the MLE. Figure 2 is an example of the WDT record measured by MLE. The stimulus temperature increased from 32 °C to 35°C and he/she perceived warm sensation, then the test was repeated (from 32°C to 33.5 °C) and he/she still perceived warm sensation, then the test was repeated (32°C) and he/she did not perceive warm sensation. The stimuli were continue until step magnitude reached 0.2°C. Finally, we counted and recorded the total number of trials (this example was 10 trials). The mean number of trials for the CDT, WDT, CPT, and HPT were as follows: 11.5±3.1, 10.3±3.8, 13.3±5.1, and 13.5±3.7, respectively, for the first test, and 9.9±2.4, 10.8±2.7, 11.5±3.2 and 12.5±3.2, respectively, for the second test. Many participants preferred the MLI and felt fatigue after many trials of MLE.
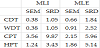
Relative reliabilities for MLE were very high, only one of the four types of QSTs’ ICC value was lower than 0.81 (ICCs for CDT, WDT, CPT, and HPT were 0.81, 0.69, 0.86, and 0.81 respectively). Although the ICCs value of most of the tests of MLI were lower than the values of the MLE, the values were still satisfied (ICCs for CDT, WDT, CPT, and HPT were 0.75, 0.65, 0.76, and 0.88 respectively). The lowest testretest reliability of WDT measured by the MLI and MLE were similar, the values of ICCs were 0.65 and 0.69 respectively, indicating good test-retest reliability.
Most of the absolute reliabilities of the MLI were better than the absolute reliabilities of the MLE. For the CDT and WDT, the values of SEM and SRD of the MLI were very small (0.38). The values of SEM (CDT and WDT) of the MLE were about 1.7 and 2.4 times than the values of the MLI (Table 2). Similarly, for HPT, the values of SEM and SRD of the MLE were larger (about 1.5 times) than the values of the MLI.
4. Discussion
In physical therapy practice, choosing a convenient and reliable method for assessing pain and sensory function is needed. This study compared the acceptability and reliability of the measuring methods for thermal QSTs. The process of the MLI was more convenient than the MLE, the relative reliabilities of the MLI and MLE were similar, while the absolute reliabilities of the MLI were better than the absolute reliabilities of the MLE.
Normal thermal detection and thermal pain detection abilities are important for our daily activities. Multiple factors may manipulate the results of measurement. The MLI to measure thermal detect thresholds and thermal pain detect thresholds depends on reaction time [4], however, the MLI is faster and easier to response to each trial [11]. Applying the results from the MLE was inconvenient. It often required more than 10 trials to complete any type of threshold measurement. The participants and examiners may fatigue after too many trials of MLE. To avoid poor effect of the consequence of fatigue, we suggest using MLI in physical therapy assessment. Assessment procedure should not increase the burden both in patients and administrator. The MLI was less time-consuming; participant will better emotion and attention to responses for each trial.
Yarnitsky and Sprecher studied the CDT and WDT reliabilities, they concluded that the reaction-time-exclusive MLE had a definite advantage over the MLI [4]. Meier et al. have studied both reliability of MLI (CDT, WDT, CPT, and HPT) and MLE (CDT and WDT) in healthy children and adolescents [12]. The median temperature of thermal tests of hand were 30.5°C for CDT and 33.7°C for WDT by MLI. The median temperature of thermal tests of hand were 31.5 °C for CDT and 32.5°C for WDT by MLE. The mean temperature of CDT, WDT and HPT of this study did not support the premise that the reaction time could be exclusive by MLE method. If the reaction time can be excluded by the MLE, the perception of the cold and warm change should occur earlier on the MLE. In this study, the perception of decreasing temperature occurred earlier with the MLI (mean values = 30.6°C and 30.8°C for men and women, respectively) and later on the MLE (mean values = 28.5°C and 30.7°C for men and women, respectively). Similarly, the perception of increasing the temperature occurred earlier on the MLI (mean values = 34.2 °C and 33.8°C for men and women, respectively) and later on the MLE (mean values = 35.2°C and 33.7 °C for men and women, respectively) (Table 1).
In this study, we also found that men and women detected thermal change and thermal pain differently. Overall, the women participants were more sensitive to temperature changes and thermal pain than were men participants. For example, on the volar side of the forearm, women detected the cold pain about at 25°C, while men detected this at about at 20°C; women detected the heat pain about at 39°C while men detected it at about 43°C. Biological and psychosocial factors may have contributed to this sex difference [13]. Sex hormones play an important role in pain, and estrogen has been reported to influence pain processing [14,15].
Using thermal QSTs assessment, a good reliability measurement method can identify the abilities. The values of ICC ≥0.75 indicated excellent reliability, and values falling within the range of 0.6 to 0.75 indicated good reliability [16]. In relative reliability, the ICCs values for the two methods were high and similar. The MLI and MLE had similar relative reliability. Heldestad et al. reported MLI is a feasible and reliable method for thermal QST on the volar surface of the lower arm [17]. Becser et al. have studied the face CDT and WDT by MLI, and showed good reliability of CDT (ICC = 0.47 to 0.71) and WDT (0.47 to 0.80) [18]. Moloney et al. have summarized the reliability of thermal testing by systematic review; there was no observable difference in reliability between MLE and MLI methods [5]. Previous researchers have thoroughly compared the reliability of the CDT and WDT [5, 17- 19], but the CPT and HPT have been less well established [20,21]. In particular, there has been no study of the MLE. Our study examined the reliability of the CPT/HPT, and this was concurrently measured with the MLI and MLE.
The absolute reliability of the MLI was better than the absolute reliability of the MLE. A small SEM and a small SRD indicate good absolute reliability [22,23]. A measurement method with high values of ICC does not necessarily indicate small measurement error. For example, the ICC of CDT on the MLE was higher than the ICC on the MLI; however, the measurement error, the values of SEM of CDT on the MLI were smaller than the values of the SEM on the MLE.
The limitations of our study are worth noting. First, sample size of this study was small. More cases and different age distribution will more powerful for estimate the reliability. Second, the measurement procedure did not random assign. A random assign study will be better than a fixed procedure study. Finally, this study only tested on volar side of the middle forearm. The reliability on other areas of the body may differ. Further studies can also investigate the responses of the different areas of the body.
5. Conclusion
All testing parameters of the MLI and MLE have are good to excellent relative reliability. However, the absolute reliability of the MLI is better than the absolute reliability of the MLE. Furthermore, the MLI is a convenience method. Therefore, for clinical practice, the MLI is recommended for thermal and pain thresholds assessment.
Competing Interests
The authors declare that they have no competing interests.
Author Contributions
All authors have participated sufficiently in the work. Dr. Lue, Ms. Liu and Dr. Lu designed the study protocol. Dr. Lue and Mr. Shih had full access to all the data in the study, took responsibility for the integrity of the data and the accuracy of the data analysis, and wrote the first draft of the manuscript. Dr. Lue, Ms. Liu and Dr. Lu provided revision of the manuscript. All authors have approved the final article.
Acknowledgments
We are most grateful to all participants for their contribution to this study.