


1. Introduction
Social capital is one of the most salient concepts in social science in understanding contemporary societies, and also is increasingly explored in relation to Information and Communication Technology (ICT). Since mobile technologies have pervaded so much in all aspects of Asian youth’s lives [1,2], the relationship between mobile phone use and social capital has caught researchers’ attention.
Social capital refers to those social resources that we invest in, accumulate, draw on and sometimes deplete within and between social networks. Putnam [3] has pointed out that networks, norms, and trust were features of social capital. Up till now, most definitions of social capital have included both a structural dimension and a psychological dimension. While the former is made up of social networks and relationships for achieving certain ends, the latter comprises a range of social attitudes, relating to a willingness to trust other people and to shared values, norms, and life satisfaction. The two dimensions make it clear that social capital might be a useful way of understanding the role that mobile phones may play. Hence we explore these questions in this study: How does mobile phone use affect social capital? Will different patterns of mobile phone use increase or decrease social capital?
Previous research suggests that even nations sharing cultural similarities report differences in mobile phone uses [4]. However, no research has explored how the differences are related to social capital. Assuming that mobile phone use may differ from country to country in the greater China due to differences in political systems, media environments, levels of press freedom, and IT developments, this study employs a comparative design that includes two Chinese cities: Shanghai and Taipei. This design allows us to explore the similarities and differences in mobile phone use among. Chinese youth in the two cities and how the different uses affect social capital.
The study shows the important role of mobile phone use in affecting the two dimensions of social capital. Such a comparative study will not only expand the scope of literature on social capital, but also contribute to the theorization of effects of the mobile phone in the era of 4G communication.
2. Theoretical Background
2.1 Influence of culture on mobile communication
Culture, defined by Hofstede [5] as the “collective programming of the mind which distinguishes the members of one group or category of people from another” (p. 5) influences institutions, behavioral patterns, norm systems, or social formats within a society [6]. Past research shows that it also plays a role in how the mobile phone is used. As Ishii and Wu [7] argued, even though the youth in different countries use the same worldwide standardization of communication technologies, they differ culturally in their personal relationship patterns, creating different media trends. Cultural differences in mobile phone use were reported in several studies [4,8-10]. In terms of perceptions and uses of mobile phones, Campbell [8] sampled college students from Japan, Sweden, Taiwan, and the United States. His results indicated some differences and several similarities among the cultural groupings.
The use of mobile phone in public places was particularly found to be impacted by cultural norms and tradition. Comparing the Netherlands and the United States, [9] found that both the Dutch and the Americans were sensitive to the intrusion of the mobile phone in public settings. However, the Americans were found to have a stronger sense of responsibility for being reachable to their colleagues and friends, meaning they use the mobile phone in public spaces. Comparing patterns in mobile-phone use in Sweden, the United States and Japan, Baron and Segerstad [11] reported a number of culturally based differences in reachability by mobile phone. Furthermore, past research explored the similarities and differences in mobile communication within a culture. Even nations sharing cultural similarities reported differences in mobile communication practices. At this level of analysis, a range of cultural, political, and economic factors would influence mobile phone use [12]. In a comparison of Western European countries, Fortunati [13] found significant differences in the perceptions of the mobile phone’s facilitation of social relationships. Italians were most favorable, followed by the French, British, Spanish, and Germans.
Therefore, we were curious whether mobile phone use might differ from country to country in Chinese cities because of differences in socio-economic development, mobile environment, marketing strategies of the cell phone industry, cultural factors, etc.
Shanghai and Taipei are close to each other in terms of Internet penetration rates (65.1% and 70.1% respectively). In terms of mobile phone penetration, they are both above 100% (109.6% and 116% respectively). Therefore, we raise the following question:
RQ1: How do college students use their mobile phones in Shanghai and Taipei? What are the differences and similarities in their mobile phone use?
2.2 Uses & gratifications of mobile phones
Mobile phones can be said to satisfy users’ new needs or the same needs in new ways. Although mobile phones have something to offer to almost everyone who derives any gratification from other media, they offer the same gratifications in a more interactive way-news, magazines, books, phone, e-mail, social media, radio, music, online games. Consequently, the uses and gratifications approach is a viable framework for investigating the impact of this emerging medium [14,15].
The recurrent theme of the theory is that people consciously seek media for obtaining specific gratifications. In simple terms, the theory suggests that the choices people make when consuming media are motivated by their desire to gratify a range of needs, and explains how and why media serve human needs [16].
The active audience approach is very consistent with the nature of mobile phone users, which have vast choices of content and different usage patterns. The notion of an ‘active’ audience and mobile communication’s inherent characteristic of interactivity make uses and gratifications a particularly relevant theoretical perspective to understand the use and motivation obtained from the medium.
Furthermore, although cross-country comparisons of communication and technology are increasing in recent years, there are no direct comparisons of mobile communication usage between China and Taiwan. The two Chinese societies are linked in their shared histories and have a common linguistic and cultural heritage. We selected Taipei, the capital of Taiwan, and Shanghai, the largest city by population in mainland China, and also a global city, a major financial center and the busiest container port in the world, primarily as case studies prior to attempting to launch mobile-related research in various cultural environments in Greater China. Specifically, we seek to explore the following research question:
RQ2: What are the differences and similarities in motivations for mobile phone use among college students in Shanghai and Taipei?
2.3 Mobile phone uses and social capital
A subject rising from the global popularity of the mobile phone is the mobile communication’s capacity to enhance a user’s social capital. Individuals who use mobile phones occupy certain positions within a web of social networks.
A review of the literature on social capital reveals that it is a highly debated theoretical construct [17,18-20]. For the sake of addressing different research questions, scholars often look at a variety of definitions of social capital [21,22]. Social capital can be seen as an important asset for creating and maintaining healthy communities, robust organizations, and vibrant civil societies. Coleman [23], Putnam [24], and Scopol [25] observed the centrality of social capital and civic engagement towards the well-being of a democratic life. In an organization, social capital refers to features of a social organization such as information, trust, and norms of reciprocity inherent in one’s social networks that can facilitate coordinated actions [26-28]. Attempts to measure social capital are also diverse and varied. There is general consensus, however, that social capital is a complex multidimensional construct and that these constructs must be culturally or contextually appropriate. Since mobile phones play an increasingly important role as a media platform for everyday interpersonal communication in contemporary societies [29,30], they have become inseparable elements of societal forms such as personal communities [31], network sociality [32] and mobile sociality [33].
However, past mobile communication research has focused on the linkage between cell phone use, measured in frequencies and locations, and the creation of social ties; little attention was paid to the different ways that individuals use the mobile phone and the effects of these differences in usage on social outcomes. For example, does mobile communication have the same effect on an individual who spends an hour a day following political news and on an individual who spends an hour a day playing games via the mobile phone? To address this gap in the literature, this study investigates the various uses of mobile phone and their effects on its users from a social capital perspective. Therefore, the following research question is raised:
RQ3: To what extent are different patterns of mobile phone use related to social capital among college students in Shanghai and Taipei?
2.4 Linking motivations and social capital
Uses and gratifications research has its foundation in communications research, which constitutes an integrated field of researchers in media, sociology, and social psychology [16]. Because uses and gratifications research focuses on the individual user in everyday life, the general idea is that users seek gratifications in media and technology use based on their individual “needs” or “motivations” [34]. From uses and gratifications studies [35,36], several motives related to usefulness are revealed. For mobile phones’ portability, people can satisfy their communication needs anytime and anywhere. As Licoppe [37] stated, carrying a mobile phone means being connected and ready to communicate with others. Users have employed the mobile phone to enhance their family bonds [38], facilitate friendships and romantic relationships [39,40], and build mutual support [41]. Ramirez et al.’s [42] study shows that mobile phones gratified various relational needs (e.g. companionship, closeness, and care) better than other media including emails and instant messaging. The mobile phone was also found to play an important role in fulfilling people’s information needs. For example, Authors [43] reported some Asian college students getting news via mobile phone and mobile phones in general may help information-seeking. Mobile phone use may also be driven by entertainment needs. Dabholkar and Bagozzi [44] found that enjoyment and fun were significant antecedents of attitude toward using mobile services.
Mobile communication has become increasingly complex, as individuals combine using phone calls, texting, instant messaging, news reading, playing games, listening to music, blogging, email, and social network services (SNS.) Therefore, different motivations probably lead to different uses, and these uses may bring various kind of social capital. For example, writing a weblog was found to be positively associated with higher levels of personal network diversity because the motivation for developing social interaction in the blog is the existence of common topics or interests. As the context of the interaction is based on mutual interests, much of the interaction is with unknown individuals who share hobbies or other concerns [45]. On the other hand, a specific SNS is more likely to be adopted because of communication needs in a peer group so SNS are primarily used for communication with people who are already part of their extended social network. As with motivations for obtaining useful information and monitoring environments, users will check weather and news updates to get a sense of security about physical or social surroundings. Given these examples of features of various mobile uses, it is reasonable to expect that a mobile phone user with different motivations can benefit (or suffer) in terms of social capital, such as networking, activity coordination, trust, group involvement, and life satisfaction. Accordingly, to investigate the extent to which individual levels of social capital can be affected by motivations, the following question is raised:
RQ4: To what extent are different motivations of mobile phone use related to social capital among college students in Shanghai and Taipei?
2.5 Social capital and social networks
As defined earlier, social capital refers to an individual’s access to resources through reciprocal social networks [46]. Putnam [3] explored the idea of social capital in a community and explained it as a person’s ability to contribute positively to a social system; norms of reciprocity and trust provide the means for individuals in the network to resolve collective problems.
Scheufele and Shah [47] identified three dimensions of social capital; social trust, life satisfaction, and civic engagement. They found that the relationship between personality strength and trust may reflect individuals’ beliefs concerning the degree to which they can influence others to adopt certain attitudes or behaviors [47].
Therefore, social network size plays a key role in measuring social capital. In general, the larger one’s social networks, the more active one will be and likely to engage in civic life and discourse participation, and ultimately contribute to the community. For example, the online social network size was found to be related to using the Internet to express oneself, indicating that larger networks promote communication and discourse [48,3]. Other studies reported similar findings. Social network size is positively related to participation in political discourse [49,50], expression [51], conversation, and debate [52].
Political scientists [53] and sociologists [54] have found that social interactions in interpersonal networks tend to enhance social participatory behavior. The ability of a person to interact with a broad social network through bonding social capital will encourage the introduction of new ideas through bridging social capital, as the greater number of people in the bonding social network means a greater possibility someone will support the bridging ideas. These findings provided the rationale for the following hypothesis:
H1: Social network size will be positively correlated with social capital.
However, past research has not explored the kinds of social capital exhibited at varying social network sizes. As we discussed earlier, Taiwan is a robust civil society, in which civil and not-for-profit organizations actively provide social and public service. These civil organizations are dependent on a network of volunteers to participate; volunteers are typically recruited through peers or peer networks. On the other hand, China is characteristic of an authoritarian society, in which the state controls everything, leaving very little space for civil organizations to exist or to operate effectively. Privately, however, there is much space for residents in China to exchange information and interact with each other on issues of public concerns through social media such as blogging, QQ, Weibo, and WeChat. Since their participation in civil organizations seems to be largely limited, residents in China tend to be more willing or ready to turn to social media on their mobile devices as alternative platforms beyond physical boundaries to voice their concerns and to exchange information not available on the mainstream media, which are heavily censored and regulated by the State. Consequently, mobile social media in China have played a pivotal role in increasing social network size and social capital in a fashion different from those in Taiwan due to differences in their political environments. In light of the differences, we anticipate the relationship between social network size and social capital will be much stronger in Shanghai than in Taipei. Therefore, we hypothesize that:
H2: Social network size will be correlated more strongly with social capital for Shanghai respondents than for Taipei respondents.
3. Method
Data used for this study came from two parallel surveys of college students in Shanghai and Taipei. A standardized questionnaire was used in each of the two surveys. In each city, the survey used a multistage sampling plan. In Shanghai and Taipei, the samples were drawn from five randomly selected universities. Three classes were randomly chosen from each university in the two cities. The selfadministered questionnaires were distributed during an eight-week period from mid-December 2010 to mid-January 2011.
Respondents were assured of complete anonymity and participation was completely voluntary. The completed sample totaled 1,923, including 723 (37.6%) from Shanghai, and 1,200 (62.4%) from Taipei. Of the sample, 42.8% were males and 57.2% were females. The average age was 20.35 years (SD = 2.80, ranging from 17 to 42). Among the 1,923 respondents, 26.9% were freshmen, 34.4% were sophomores, 19.2% were juniors, and 19.6% were seniors.
3.1 Measurement of key variables
General mobile phone use: Respondents were asked to report how many calls they made and received with their mobile phones per day. The two items were added and divided by two to form a measure of "frequency of calls made and received" (M = 4.10, SD = 4.54, r = .81). Respondents were also asked how many text messages they sent and received with their mobile phone per day. The two items were also added and divided by two to form a measure of "frequency of texting messages sent and received" (M = 7.33, SD = 11.85, r = .96).
Specific mobile phone use: Respondents were also asked how often they had used their mobile phone to (1) surf the Internet, (2) send and receive e-mails, (3) chat via instant messenger, (4) use a blog, (5) use Twitter, (6) play games, (7) listen to music, and (8) take photos. The response categories ranged from 1 (never) to 4 (often). Results of a principal component factor analysis with varimax rotation showed that the items were clearly grouped in two factors. The two-factor solution explained 61.95% of the variance. The first factor consisted of the first five items (eigenvalue = 3.28; 40.98% of variance). The five items were combined to form an index of “interactive use” (M = 2.85; SD = .69; α = .87). The second factor consisted of the last three items (eigenvalue = 1.68; 20.97% of variance). Thus, the three items were averaged to form an index of “personal use” (M = 1.77; SD = .83; α = .58).
Motivations of mobile phone use: Drawing on motives identified in previous studies on uses and gratifications [36,42,55-57], our survey used a list of 14 motivation items (we finalized the list based on a pilot study). Principal component factor analysis of these items with varimax rotation led to a four-factor solution, accounting for 74.82% of variance. Based on results of principal component factor analysis of the mobile phone motive statements, four highly reliable motivation indices were created.
The first factor consisted of five items that reflected the motivation for using mobile phones to gossip or chap, to seek the pleasure of talking, to relax, to relieve boredom, and to pass time (eigenvalue = 3.33; 23.81% of variance). The five items were combined to form an index of “entertainment and relaxation needs” (M = 3.34; SD = .90; α = .88). The second factor contained three items including seeking updated information on news, products and services, and entertainment (eigenvalue = 2.65; 18.89% of variance). The three items were added and divided by three to form a measure of "surveillance needs" (M = 2.81, SD = 1.00, α = .91).The third factor consisted of three items that reflected the motives of using mobile phone to share ideas and opinions, to give or receive advice on personal issues, and to discuss or coordinate social events (eigenvalue = 2.32; 16.54% of variance). The three items were combined to form an index of “social interaction needs” (M = 3.27; SD = .89; α = .84). The fourth factor consisted of three items: to keep in contact with people you don’t have enough time to see in person, to keep in contact with others who live far away and to keep in touch with family members (eigenvalue = 2.18; 15.58% of variance). The three items were combined to constitute an index of “communication needs” (M = 4.05; SD = .70; α = .79).
Size of mobile network: Respondents were asked to indicate their agreement on a five-point Likert scale (“1” means “strongly disagree” and “5” means “strongly agree”) with these statements reflecting their anticipations of the usefulness of mobile phones in estimating: (1) the number of friends they have linked to via SNS, (2) the number of friend connections they have not actually met face-to-face (F2F) on SNS, and (3) the number of friends they have frequently kept in touch with online on SNS. An exploratory factor analysis showed that the three items grouped in a single factor, indicating that they measured a single underlying concept (eigenvalue = 2.59, accounting for 86.36% of the variance). The three items were averaged to create a composite measure of “size of mobile network” (M = 2.95, SD = 1.05, α = .92).
Social capital: Based on previous studies, social capital is composed of the following dimensions: group involvement, leisure activity, interpersonal trust, and life satisfaction.
Group involvement: To measure group involvement, respondents were asked to indicate how often they had participated in the following activities in the past year: any activities of an organization, any activities on campus, and any class or department activities. The responses categories ranged from 1 (never) to 4 (often). Results of a principal component analysis show that the three activities were grouped in a single factor, suggesting that they measured a single underlying concept (eigenvalue = 2.98, accounting for 99.26% of the variance). The three items were combined to constitute an index of “group involvement” (M = 2.86; SD = .78; α = .82).
Leisure activity: Four items were used to measure respondents’ leisure activities. Respondents were asked to indicate how often they participated in the following activities: dine out with friends, hang out with friends, play a team sport with friends, and go to movies or concerts with friends. The response categories also ranged from 1 (never) to 4 (often). Principal component analysis showed that the four items were grouped in a single factor and measured the same underlying concept (eigenvalue = 3.90, accounting for 97.59% of the variance). The three items were combined to constitute an index of “leisure activity“ (M = 3.19; SD = .58; α = .74).
Interpersonal trust: Four questions were used to estimate interpersonal trust using a five-point Likert scale (“1” means “strongly disagree” and “5” means “strongly agree”): “Do you agree that most people around me are honest?” “Do you agree that most people around me are trustworthy?” “Do you agree that most people around me can look out for each other?” and “Do you agree that most people around me are reliable?” Results of a principal component analysis show that the four activities used to measure interpersonal trust were grouped in a single factor (eigenvalue = 3.92, accounting for 98.07% of the variance). The four items were combined to form an index of “interpersonal trust” (M = 3.74; SD = .72; α = .93).
Life satisfaction: Four items that were adopted from previous studies [58] were used to measure respondents’ life satisfaction. Respondents were asked to express their agreement, on a scale from 5 (strongly agree) to 1 (strongly disagree), with the following statement: (a) “I worry about my future,” (b) “I wish I could lead a totally different life,” (c) “If I could lead another life, I would do some things differently,” and (d) “Sometimes I feel that I don’t have enough control over the direction my life is taking.” Results of a principal component analysis show that the four items were grouped in a single factor, suggesting that they measured a single underlying concept (eigenvalue = 3.73, accounting for 93.34% of the variance). The four items were combined to create an index of “life satisfaction” (M = 3.40; SD = .75; α = .78).
Control variables: Respondents self reported the number of days per estimated amount of time per day spent watching television, listening to radio, and surfing the Internet. Finally, respondents were asked about their gender, age, and years of study. These variables were used as controls in the regression analyses because previous studies indicated that they were related to mobile phone use [36,38].
4. Findings
All of the 1,923 respondents were mobile phone users. Of the sample, 41.1% owned a smart phone and 58.9% had a non-smart phone. Shanghai has higher number of user’s higher users of smart phones than Taipei. In the two cities, respondents had used mobile phones for periods ranging from less than one year (0.7%) to 15 years (0.3%) (M = 6.41 years, SD = 2.80).
RQ1 explored how Chinese college students use their mobile phones. Results of frequency analysis show that the respondents used their mobile phones very frequently. The average number of calls made in a day was 4.15 (SD = 4.88) and the average number of calls received per day was 4.09 (SD = 4.74). The average number of messages sent per day was 7.06 (SD = 12.05) and the average of messages received per day was 7.73 (SD = 12.60).
Results of independent t-tests indicated significant differences in mobile phone use among respondents in the two cities (see Table 1). As for the specific use of mobile phone, the most frequent use of mobile phone for respondents across the two samples was to take photos, followed by listening to music, playing games, surfing the Internet, chatting via instant messenger, using Twitter, and sending and receiving e-mails. The least frequent use was to use blog through the mobile phone.
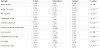
Results of independent t-tests indicate that there were significant differences in mobile phone use among respondents in the two cities. As shown in Table 1, the Shanghai respondents were more likely to use the mobile phone to surf the Internet, chat via instant messenger, send and receive e-mails, use blog and tweeter. The Taiwan respondents were more likely to use the mobile phone to take photos, play games and to listen to music.
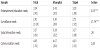
RQ2 explored the differences and similarities in motivations for mobile phone use among respondents. As shown in Table 2, the respondents from both cities rated communication needs as the most important motivation for using the mobile phone use, followed by entertainment and relaxation and social interaction. Surveillance was rated as the least important motivation for using the mobile phone use. Results of independent t-tests indicate that there was a significant difference among respondents in the two cities; the Shanghai respondents had a higher motivation for using the mobile phone for entertainment/relaxation and surveillance. However, there were no significant differences among respondents in the two cities for using the mobile phone for social interaction and communication needs.
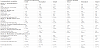
RQ3 explored the relationships between mobile phone use and social capital. To answer this research question, four separate hierarchical regression analyses were performed. Tables 3 and 4 summarize the results of the hierarchical regression analyses in which gender, age, and smart phone ownership were entered first into the equation, followed by television use, radio use, newspaper use, and Internet use. The third block included the two general mobile phone use variables, frequency of calls made and received and frequency of texting messages sent and received. The fourth block entered the two specific mobile phone use variables, interactive use and personal use. The fifth block entered size of mobile social network. The final block entered the motivation of mobile phone use.
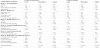
Results of the hierarchical regression analyses show that frequency of calls made and received was a significant predictor of leisure activity ( β = .13, p > .001), but it was not significantly associated with group involvement ( β = .03, p > .05), interpersonal trust ( β = .01, p > .05) and life satisfaction ( β = .02, p > .05). Frequency of texting messages sent and received was not a significant predictor of any of the four social capital variables.
Interactive use was also not significantly associated with any of the four social capital variables. Personal use was a significant predictor of group involvement ( β = .13, p < .001), leisure activity ( β = .17, p < .001) and interpersonal trust ( β = .04, p <.05), but it was not significantly related to life satisfaction ( β = .04, p > .05).
To explore whether the relationship between mobile phone use and social capital varies across the two Chinese cities, eight hierarchical regression analyses were performed. Tables 3 and 4 summarize the results of the hierarchical regression analyses. As these tables show, in the Shanghai sample, frequency of calls made was not a significant predictor of any of the four social capital variables. Frequency of texting messages sent was significantly associated with leisure activity ( β = .10, p < .01). Interactive use was a significant predictor of leisure activity ( β = .131 p > .05), while personal use was significantly related to group involvement ( β = .11, p > .05).
In the Taipei sample, frequency of calls made was a significant predictor of group involvement ( β = .08, p > .05) and leisure activity ( β = .17, p > .001). Frequency of texting messages sent was significantly and negatively associated with group involvement ( β = -.07, p > .05). Although interactive use was not a significant predictor of any of the four social capital variables, personal use was significantly associated with group involvement ( β = .14, p > .001) and leisure activity ( β = .19, p > .001).
RQ4 examined the relationships between motivations of mobile phone use and social capital. Results of the hierarchical regression analyses (Tables 3 and 4) show that entertainment and relaxation needs significantly predicted leisure activity ( β = .08, p < .01), interpersonal trust ( β = .06, p < .01) and life satisfaction ( β = .19, p < .001). Surveillance needs were not significantly associated with any of the four social capital variables. Social interaction needs were significantly and positively associated with group involvement ( β = .09, p < .01), leisure activity ( β = .09, p < .01), and interpersonal trust ( β = .05, p < .01), but were not significantly related to life satisfaction ( β = .01, p > .05). Communication needs significantly predicted group involvement ( β = .06, p < .05), leisure activity ( β = .09, p < .01), and interpersonal trust ( β = .19, p < .001), but they were not significantly related to life satisfaction ( β = -.01, p > .05).
In the Shanghai sample, Tables 3 and 4 show that entertainment and relaxation needs significantly predicted life satisfaction ( β = .20, p < .001), while surveillance needs were significantly associated with leisure activity ( β = .10, p < .05). Although social interaction needs were not significantly associated with any of the four social capital variables, communication needs significantly predicted interpersonal trust ( β = .24, p < .001).
In the Taipei sample, entertainment and relaxation needs significantly predicted leisure activity ( β = .11, p < .01) and life satisfaction ( β = .15, p < .001). Surveillance needs were not significantly associated with any of the four social capital variables. Social interaction needs were significantly and positively associated with interpersonal trust ( β = .12, p < .001), while communication needs significantly predicted leisure activity ( β = .11, p < .01) and interpersonal trust ( β = .12, p < .001).
H1 predicted that size of mobile social network would be positively related to social capital. To test this hypothesis, four hierarchical regression analyses were performed. The regression analyses show that size of one’s mobile social network was a significant predictor of group involvement ( β = .15, p < .001), leisure activity ( β = .07, p < .01), interpersonal trust ( β = .09, p < .01), and life satisfaction ( β = .08, p < .01). H1 was supported.
H2 predicted that size of mobile social network would be more strongly related to social capital for Shanghai respondents than for Taipei respondents. To test it, Pearson correlations were performed. Results of the analyses showed that social network size was significantly and positively related to group involvement in the Shanghai sample (r = .26, p < .001) and in the Taipei sample (r = .12, p < .001). A Z test for two correlation coefficients showed that the difference was statistically significant (Z = 3.13, p < .01). The results showed that social network size was more strongly correlated with leisure activity for the Shanghai respondents (r = .28, p < .001) than for the Taipei respondents (r = .20) (Z = 1.95, p < .05). The correlation analyses also indicated that social network size was more strongly correlated with interpersonal trust for the Shanghai respondents (r = .34, p < .001) than for the Taipei respondents (r = .09, p.01) (Z = 5.60, p < .001). Finally, the results showed that social network size was significantly and positively related to life satisfaction for both the Shanghai respondents (r = .26, p < .001) and the Taipei respondents (r = .10, p < .01). A Z test for two correlation coefficients showed that the difference was statistically significant (Z = 3.45, p < .001). H2 was also supported.
In order to gain further insight into the relationship between social network size and social capital, four separate hierarchical regression analyses were performed. As shown in Tables 3 and 4, in the Shanghai sample, size of one’s mobile social network was a significant predictor of group involvement ( β = .22, p < .001), leisure activity ( β = .18, p < .001), interpersonal trust ( β = .26, p < .001) and life satisfaction ( β = .17, p < .001). In the Taipei sample, size of one’s mobile social network significantly predicted group involvement ( β = .11, p < .01), leisure activity ( β = .07, p < .01), but it was not a significant predictor of interpersonal trust ( β = .06, p > .05) and life satisfaction ( β = .06, p > .05). Altogether, the results of the four regression analyses provided additional evidence in support for H2.
5. Discussion
In the era of 4G, the mobile phone has become an increasingly popular platform for daily communication. Findings of our study show young adults in the two Chinese cities used their mobile phones frequently. On the other hand, there were some interesting differences in mobile phone use among respondents. The Shanghai respondents sent and received more text messages than the Taipei respondents. Cost may be a factor for users in the Chinese mainlander; the popularity of IM in Taiwan may offer an explanation for less texting among the Taiwan respondents.
More importantly, the findings reveal some key differences and similarities in the respondents’ motivations for mobile phone use. The respondents from both cities rated communication needs as the most important motivation for using the mobile phone use, followed by entertainment/relaxation and social interaction. Surveillance was rated as the least important motivation. However, the Shanghai respondents had higher motivation for using the mobile phone for entertainment/relaxation, surveillance and social interaction. Considering that the media are tightly controlled by the government, including censoring prime-time TV programming in China, it is unsurprising that college students in Shanghai exhibited a stronger motivation to seek entertainment and news from the less regulated smart phones, which function as a mobile Internet.
Regarding the relationships between mobile phone use and social capital, we found the frequency of calling was a significant predictor of leisure activity, but it was not significantly associated with group involvement, interpersonal trust and life satisfaction. Frequency of texting and interactive use were not significantly related to any of the four social capital variables. However, personal use was significantly and positively associated with group involvement, leisure activity, interpersonal trust and life satisfaction. The findings suggest that mobile phone calls are used basically for utilitarian purposes, and people may make phone calls via mobile to someone with whom they are not necessarily very close. Therefore, making and receiving phone calls enhances group involvement and leisure activity, rather than interpersonal trust and life satisfaction. Texting may seem more socially expressive. Despite the fact that text messaging is not a rich medium [59,60], it is commonly appropriated for personal com¬munication among people with strong ties [39,57,61], which might explain the positive and signifi¬cant coefficients between it and leisure activity that primarily involve person-to-person connectivity. As Kluger [62] has put it, texting has replaced phone calls as people’s preferred means of mobile conversation, which means users can control a conversation about what to say and when to say it by texting.
With regard to the relationship between motivations for mobile phone use and social capital, entertainment and relaxation needs significantly predicted leisure activity, interpersonal trust, and life satisfaction. Surveillance needs were not significantly associated with any of the four social capital variables. Social interaction needs were significantly and positively associated with group involvement, leisure activity, and interpersonal trust, but were negatively related to life satisfaction. Communication needs significantly predicted group involvement, leisure activity, and interpersonal trust, but were not significantly related to life satisfaction. The finding that entertainment and relaxation, communication needs, and social interactions are stronger predictors of enhancing social capital than surveillance needs does fit the general picture of people having more communication, entertainment and social motives for bonding and bridging social ties. Social and psychological mechanisms may be at play here. Surveillance needs, measured by seeking updated information on news, products and services, and entertainment may seem instrumental and extrinsic motivations. Thus, the rewards for those extrinsically motivated users seem less likely to be any dimension of social capital.
Moreover, the size of one’s mobile social network was found a significant predictor of group involvement, leisure activity, interpersonal trust, and life satisfaction. Additional results suggest that social network size was more strongly associated with social capital for the Shanghai respondents than for the Taipei respondents. Consistent with the findings of Hampton and Lee’s study [63] on the impact of use of information communications technology on network diversity and social capital, this study confirmed that differences in mobile phone use in the same culture might cause differences in personal networks and social capital. In China, due to the tight control and restrictions on offline civil organizations, residents in China tend to be more willing and ready to be part of online communities formed by various social media, which are also available on mobile devices. Therefore, personal networks in China tend to be less place-relevant or sensitive than those in Taiwan, where residents have much more freedom to participate offline or physically in various civil organizations. Being less place-relevant or -sensitive, the size of social networks formed through social media play an important role in determining personal trust as the larger social network tends to be more trustworthy than the smaller one.
Accordingly, these findings contribute to the existing studies of social capital by empirically investigating the relationship between size of mobile network and social capital. The results of the study demonstrate that the predictive power of mobile network size on social capital differs in the two Chinese societies. It is apparent that societal factor has a strong impact on the relationship between the size of mobile network and social capital. The relationship between mobile network size and social capital should be continuously examined.
Despite the contribution, this study has its limitations due to the lack of generalizability. The use of a sample of college students in urban areas, rather than the use of a random sample of general public, may cause underestimates of the empirical range of error. Consequently, future research should consider using a sample from the general population. Another limitation of this study is that cultural values measures were not included in this study, making it impossible to examine the impact of cultural values on mobile phone use. Future efforts should explore the relationships among cultural values, mobile phone use and social capital.