


1. Introduction
Carbon dioxide is the dominant greenhouse gas leading to Global Warming. If man does nothing to intervene, atmospheric CO2 levels are projected to more than double to over 900 ppmv by 2100 [1]. Corporations and governments have set goals of achieving Net Zero CO2 by 2030-2050. A CO2 material balance indicates: In - Out = Net Rate of Accumulation. To achieve Net Zero CO2, CO2 removal must equal CO2 generation, which is currently about 35 giga tonnes/yr (Gt/yr). Preferably CO2 removal from the atmosphere exceeds generation to reduce the level of CO2 already in the atmosphere, which is already leading to Global Warming.
Solutions proposed for reducing CO2 can be placed in two categories: 1) solutions that focus on reducing future CO2 emissions from continued use of fossil fuels; and 2) solutions that can remove CO2 already in the atmosphere.
Examples of technologies in the first category include: renewable energy such as wind and solar; green hydrogen from electrolysis using renewable energy; bioethanol or biodiesel fuels; nuclear energy; Carbon Capture and Storage (CCS) from large point sources, such as furnaces in coal- or natural gas-fired power plants; and blue hydrogen from the Steam Reforming of Methane (SRM) with CCS. A windmill or solar park built today will reduce future emissions of CO2 from continued use of fossil fuel energy they displace. They will not remove CO2 already in the atmosphere. All of the technologies combined that lie in the first bucket are falling short of achieving Net Zero CO2 by 2030-2050.
The second category requires technologies that offer a form of Direct Air Capture (DAC) of CO2 already in the atmosphere. Examples of technologies in the second category include: Direct Air Capture (DAC) technologies offered by Climeworks or Carbon Engineering that capture the exceeding low level (400 ppmv) of CO2 in the atmosphere by using large fans to pass air through CO2 absorbents or adsorbents [2,3]; enhanced weathering of minerals like olivine added to the ocean to counteract acidification and dissolve additional CO2 in ocean waters [4]; CO2 produced by the fermentation reaction during bioethanol production but only if bioethanol plants are equipped with CCS; and biomass sequestration, which is the subject of this manuscript.
The Climeworks DAC technology which absorbs CO2 on amines and the Carbon Engineering technology which captures CO2 by high temperature reaction with Ca(OH)2 followed by high temperature calcination to cycle the reaction product CaCO3 back to Ca(OH)2 are extremely expensive [5].
Bioethanol processes may fall into both categories. Bioethanol fuel itself is renewable. Corn growth pulls CO2 from the air, but the carbon in bioethanol is released back to the air as CO2 when it is burned. Bioethanol fuel does displace future emissions from the burning of gasoline, a fossil fuel. As shown below, bioethanol production also produces CO2 via the fermentation reaction. That CO2 could fall into the second category, but only if the bioethanol plants are equipped with CCS. However, most bioethanol plants currently vent the CO2 to atmosphere.
Bioethanol will be examined in detail and shown to offer very low carbon efficiency (that fraction of carbon in the entire corn plant that contributes towards the reduction of CO2), and it will also be shown to be very energy inefficient. Here, sequestration of entire plant matter is proposed as a method that can achieve very high carbon efficiency for CO2 removal.
The most natural form of Direct Air Capture is to grow biomass via photosynthesis and sequester that biomass underground. In the normal Carbon Cycle, biomass dies and decomposes and releases its carbon as CO2 back to the atmosphere. To achieve a net reduction in CO2, it is necessary to break the Carbon Cycle by permanently sequestering biomass underground and preventing its decomposition. In normal municipal landfills, only a certain fraction of organic material undergoes decomposition before the landfill becomes dormant and decomposition ceases. Understanding the distinct chemistry phases that municipal waste decomposition undergoes in landfills provides clues in how to reduce decomposition even further.
Permanent burial of wood has been proposed previously [6]. Here, tree leaves and biomass grown on-purpose, such as high yield switchgrass, are proposed as good sources of biomass. Left unsequestered, leaves decompose with a short Carbon Cycle time constant releasing CO2 back to the atmosphere. In any given year, leaves represent a small fraction of above ground biomass. However, when integrated over the life of a tree, they can represent a substantial fraction of the total biomass generated. Theoretically, there is enough biomass grown every year to achieve Net Zero CO2 if permanently sequestered.
If decomposition of buried biomass can be inhibited, then the sequestration of biomass can become a natural, carbon efficient, and low-cost method of Direct Capture. Biomass sequestration can provide CO2 removal on gigatonnes per year scale and can be implemented in the needed timeframe (2030-2050).
2. The Energy Scene
Before discussing CO2 removal, it is helpful to examine the current energy scene, to understand how large the problem is, to examine which fuels produce CO2, and where they are used. The US Energy Information Authority provides a database that tracks primary energy production and disposition for the US, and other world regions [7]. BP provides its yearly Statistical Energy Review [8].
Figure 1 shows the US 2016 (pre-pandemic) primary energy sources and sectors in which the energy is used [9]. The three largest sources are petroleum (37%), natural gas (29%), and coal (15%), fuels that generate CO2. In 2016 only about 20% of US primary energy came from non-CO2 producing fuels (renewables and nuclear). In 2016, CO2 emissions were 33 Gt [9]. The world has a huge CO2 problem that will take a variety of huge solutions to solve.
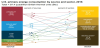
The numbers on the left of the lines connecting sources to usage sectors show the percentage of a source that goes to a corresponding sector. The major sectors are transportation (29%), industry (22%), and electric power (39%). Industrial use accounts for 22% and residential and commercial accounts for 11%.
The numbers on the right of Figure 1 show the percentage of energy used in a sector that comes from the corresponding source. Thus, 71% of petroleum goes to the transportation sector with most of the balance (23%) going to industry, and only minor amounts to residential and commercial and electric power sectors. Natural gas usage is split almost evenly amongst industrial, residential and commercial, and electric power, with very little to transportation. Coal and nuclear are almost exclusively used to generate power.
Reducing CO2 emissions can be done by attacking either the left side or the right side of Figure 1. Attack on the left requires finding alternates for fossil fuels. Figure 1 shows that there is a long way to go to achieve this goal, since the total of US non-fossil fuels (renewables and nuclear) is currently only about 20%. Attacking Figure 1 on the right requires reducing of energy consumed by the energy sectors or modification of the sectors themselves. The transition of passenger vehicles to electric vehicles (EVs) would be an example of modifying the transportation sector.
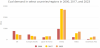
Figure 1 shows the US energy demand. World energy demand is different. In particular, coal represents a much higher fraction of energy demand in China. China dominates world energy demand. Asia and Oceania account for almost half of total energy demand. Thus, it is not surprising that coal and coke (a heavy-end solid refinery byproduct that can be substituted for coal) represent about 44% of total energy demand. Petroleum and other liquids represent about 36%, and natural gas about 20%. Coal usage in China exceeds that in the rest of the world combined, as shown in Figure 2. Thus, while coal usage is declining worldwide, it will continue to play a major role in China, and a solution is needed for the CO2 coming from coal.
The EIA provides a projection for the shift in all energy sources for US electricity production (Figure 3), and further granularity for the sources of renewable energy for electricity production out to 2050 (Figure 4) [10]. Coal is expected to decline from 24% to 13%, and nuclear is expected to decline from 19% to 12%. Renewable energy is projected to double but will still be under 40% of the total energy sources.
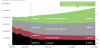

The absolute amount of electricity from wind is projected to double. Solar is projected to increase by a factor of 9. Is that a reasonable projection? Natural gas has become cheap and abundant in the US after the advent of fracking. The EIA projects that the fraction of electricity coming from natural gas remains about constant near 36 to 37% out to 2050. This is still a very significant percentage and a significant percentage of CO2 production. Thus, a means to sequester CO2 during the production of electricity from natural gas is needed, especially if the projected increase of electricity from solar falls short.
The energy for transportation is distributed between passenger cars, long haul trucks, aviation, rail, and marine. US passenger cars are currently fueled primarily by gasoline. In the US, gasoline represents about 47% of refined products [11]. Distillates represent about 30%, with LPG (7%) and Other Petroleum Liquids (chemical feedstocks, etc.) representing the balance. Thus, the gasoline: distillate ratio in the US is: 47:30 = 61%:39%. US distillate fuels represent about 20% of US refined products with about 67% of distillates used for on-highway diesel mainly for long haul trucks. Jet fuel is lumped in with distillates and represents about 8% of US refined products [12]. Diesel cars are more popular in Europe. Thus, for example in Germany, distillate fuel oils represent about 46% and gasoline only about 18% of refined products [11].
US gasoline currently contains about 10 vol% bioethanol. Thus, bioethanol represents only a very small amount of total US energy consumption, and of course, a smaller fraction worldwide: (29% transportation of total x 61% gasoline x 10% ethanol = 1.8%).
And this comes at great economic and social cost. Corn is the largest crop in the US, and about 40% of the US corn crop is currently devoted to bioethanol, which has spurred the debate about food for fuel [13].
3. Understanding the Carbon Cycle
The Carbon Cycle is misunderstood by many. There are those who believe planting more trees will lead to a continued reduction in atmospheric CO2. It is true that deforestation and burning of forests to clear land leads to a one-time large release of CO2, and reforestation leads to a one-time reduction of atmospheric CO2 until they mature. However, when trees are followed through their entire life cycle, trees are sustainable. They pull CO2 from the air for growth during their life. However, in unmanaged forests, trees die and decompose, releasing their stored carbon back to the atmosphere. Thus, trees are sustainable. Over their entire life and death cycle, unmanaged forests do not lead to a continued net reduction in CO2 that is already in the atmosphere.
Trees lose their leaves every year, which decompose and release their stored carbon back to the atmosphere on a time scale of approximately one year. In any given year, leaves represent a small fraction of above ground biomass. However, it will be shown that when integrated over the life of a tree, they can represent a substantial fraction of total biomass generated. Thus, leaves represent a “free” source of biomass that is currently wasted and not leading to a net reduction of CO2 in the atmosphere.
Plants get all of their carbon for their growth from CO2 in the atmosphere via photosynthesis, forming mainly carbohydrates [14]. The photosynthesis reaction can be represented crudely by the reaction:
The simplest formula representation of carbohydrates is CH2O, Thus the amount of CO2 plants pull from the atmosphere can be calculated roughly from plant mass using the ratio of molecular weights: (44.01 gm/mol CO2)/(30.03 gm CH2O). This is only a good approximation since plants also contain oxygen deficient compounds such lignin, N, P, and other trace elements.
Plant matter is fed to animals and plants and animals are fed to humans. Animals and humans respire the bulk of the carbon in their food as CO2 when they exhale. Animals and humans grow and thus serve as temporary storage vessels for some of the carbon. However, plants, animals, and humans eventually die and decompose and release their carbon back to the atmosphere as CO2, completing their part of the Carbon Cycle.
While plants receive all of their carbon from the atmosphere, they draw water as a source of hydrogen, nitrogen, phosphorous and other nutrients such as potassium from the soil. The enzyme that catalyzes photosynthesis contains both nitrogen and phosphorous [14]. In the natural Carbon Cycle, dead plant material returned to the soil feeds the worms, bacteria, and fungi that decompose it releasing the needed N, P, K, and other nutrients back into the soil. That is part of the Carbon Cycle. Intensive farming requires artificial fertilizer to provide some of the nutrients removed with the farm products. However, note that natural forests thrive without artificial fertilization.
Normally there is no net buildup of carbon in the soil. Soil carbon generally reaches a steady state carbon level of 1-4 weight percent (wt%) [15]. There can be a small increase or decrease of plant matter carbon in the soil, depending on farming practices. However, it is small and limited. If there were a large net movement of carbon to the soil the ground would rise. Empirical observation indicates this is not the case.
Thus, the normal Carbon Cycle is sustainable. Over time, there is no net movement of CO2 to the atmosphere and no net movement of carbon into the soil. The only way to remove CO2 already in the atmosphere is to break the cycle. Biomass must be grown from CO2 in the atmosphere and the biomass must be sequestered (Carbon sequestration, not CO2 sequestration).
4. Bioethanol: Carbon and Energy Inefficient
One advantage that will be claimed for biomass sequestration is high carbon efficiency for the reduction of CO2. In this section, bioethanol will be shown to be a very inefficient use of biomass carbon for reducing CO2. It will also be shown to be very energy inefficient. As noted above, about 40% of the US corn crop is currently devoted to fuel ethanol [13], while it contributes only about 1.8% of total US energy needs.
The starch in corn kernels is a polymer of the 6-carbon sugar glucose. Bioethanol production begins by depolymerizing starch via hydrolysis to release the glucose monomers, followed by fermentation. The fermentation reaction converts only 4 of the 6 carbons in glucose sugar formed by hydrolysis of corn starch to ethanol and 2 carbons to CO2. That is why beer and champagne are bubbly.
The vent gas from bioethanol plants is nearly pure CO2. Thus, it does not require equipment for separation, and it is the easiest large industrial CO2 stream to capture and sequester. However, most US ethanol plants currently vent the CO2 to atmosphere. The 4 out of 6 sugar carbons that go to bioethanol represent renewable carbon that will displace future fossil fuels from continued gasoline production. They will not reduce CO2 already in the atmosphere. Only the 2 of 6 carbons that go to CO2 during fermentation will represent Direct Air Capture CO2, and only if bioethanol plants are fitted with CCS.
The overall carbon efficiency for bioethanol’s CO2 reduction potential must start with the total carbon in the corn plant. The overall carbon efficiency of converting a corn plant into either corn ethanol or CO2 from ethanol fermentation that could contribute to pulling CO2 from the air with ethanol plant CCS is quite small. A corn plant is about 35 wt% corn kernels [16]. Corn kernels are about 70% starch which is hydrolyzed to glucose sugar. Only 4 of 6 carbons in the glucose go to ethanol, and 2 go to CO2. Thus, the carbon efficiency is about:
35% kernels x 70% starch x 4/6 carbons to ethanol = 16.4% for ethanol (renewable carbon) 35% kernels x 70% starch x 2/6 carbons to CO2 = 8.2% for CO2 (carbon that could be captured) Only the CO2 can be counted towards CO2 removed from the air, and only if the bioethanol plants incorporate CCS. High carbon efficiency will be one of the main advantages for biomass sequestration as shown below.
Now consider the energy efficiency of bioethanol production. Bioethanol from corn is not break-even sustainable, when the energy used to produce the corn and used within the process is considered. A process flow diagram for a Dry Grind Bioethanol plant (the current preferred process for producing bioethanol in the US) is shown in Figure 5. The corn is first ground in hammermills, and then mixed with water and this “mash” is cooked by heating with steam. Cooking the mash releases starch from gluten (proteins) that hold starch packets in place. Enzymes are added to serve as catalysts to depolymerize the starch by hydrolysis and release the glucose sugar monomers. The sugars then undergo fermentation under the action of yeast to form a “beer,” containing about 15% ethanol in water. Separating ethanol from the water in the beer is very energy intensive. The energy needed to remove water just up to the azeotropic composition is about 18% of the heat of combustion of the ethanol product [17]. Final removal of water contained in the azeotrope can be achieved by energy intensive azeotropic distillation or by less energy intensive separation by molecular sieves. The total energy for a corn Dry Grind ethanol plant can be as high as 33% of the heat of the product combustion [18].
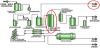
Note that CO2 is shown as a byproduct of bioethanol production. Currently, most bioethanol plants in the US do not recover the CO2 and vent it to atmosphere.
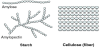
Bioethanol from cellulosic biomass has been a long-term goal due to potentially cheap feedstock and no diversion of food to fuel. In 2009, a Sandia study indicated that 70 billion gallons of cellulosic ethanol should be “possible” by 2030 [19]. However, almost 10 years later, only about 15 million gal were produced in 2018 [20]. The reality is that continued economic and technical challenges remain. Starch has two forms, amylose, in which the polymers are linear, and amylopectin, which is mainly linear with a small amount of branching. However, as shown in Figure 6, the sugars in lignocellulose cross link and densely pack, making cellulose insoluble in water, and thus, the first step, attack of the linkages to hydrolyze and release the sugars is very difficult. Pretreatment to release the sugars requires high temperature treatment by corrosive acids or bases or expensive enzymes, such that the cellulose pretreatment step can be one third of the total capital for cellulosic ethanol.
The properties that make cellulose is difficult to depolymerize will help limit lignocelluloses decomposition during biomass sequestration.
5. The Chemistry of Biomass Degradation in Landfills
Municipal waste is buried in landfills, where a portion slowly decomposes. It undergoes a combination of aerobic and anaerobic decomposition to produce a biogas. Modern municipal waste landfills undergo several distinct stages [21-23]. Understanding the chemistry of the phases provides clues on how to disrupt decomposition at each phase.
5.1 Phase I (aerobic decomposition)
During the first phase of decomposition, aerobic bacteria consume oxygen while breaking down the complex carbohydrates, proteins, and lipids that comprise organic waste. Aerobic bacteria require oxygen to live. The primary byproduct of this process is carbon dioxide. Nitrogen content is high at the beginning of this phase, due to nitrogen in the air that supplies the oxygen for aerobic decomposition. Nitrogen content continuously declines as the landfill moves through the phases. Phase I continues until available oxygen is depleted. Phase I decomposition can last for days or months, depending on how much oxygen is present when the waste is placed in the landfill, which can vary depending on how compacted the waste was when buried. Starving the biomass of oxygen by minimizing air infiltration during Phase I would mitigate anaerobic decomposition during Phase I.
5.2 Phase II (acid phase)
Phase II decomposition starts after the oxygen in the landfill has been depleted. Anaerobic bacteria then convert compounds created by aerobic bacteria into acetic, lactic, propionic, and formic acids and alcohols such as methanol and ethanol. The landfill becomes highly acidic. With the presence of moisture, the acids cause certain nutrients to dissolve, making nitrogen and phosphorus nutrients available to the bacteria present during this phase. The biogas comprises mainly carbon dioxide and hydrogen during this phase. pH adjustment by adding bases might be used to disrupt nutrient release during Phase II.
5.3 Phase III (methane formation)
Phase III decomposition starts when anaerobic bacteria consume the organic acids produced in Phase II and form acetates. This process causes the landfill to become a more neutral environment in which methane-producing bacteria establish themselves. Methane- and acid-producing bacteria have a mutually beneficial relationship. Acid producing bacteria create compounds for the methanogenic bacteria to consume. Methanogenic bacteria consume the carbon dioxide and acetate, too much of which would be toxic to the acid-producing bacteria. Both require the nutrients released in Phase II.
5.4 Phase IV (stable anaerobic phase)
Phase IV decomposition begins when both the composition and production rates of landfill gas remain relatively constant. Phase IV landfill gas usually contains approximately 45% to 60% methane by volume, and 40% to 60% carbon dioxide. Methane has a climate change potential that is 25 times more powerful than CO2. Thus, anaerobic decomposition is to be discouraged, or the methane must be captured and burned to convert it to renewable CO2. The optimal pH for anaerobic decomposition is around 7. Anaerobic bacteria cannot tolerate pH <6 or pH >7.5 [23]. Thus, adding acid can kill the anaerobic bacteria and mitigate Phase IV decomposition.
5.5 Phase V (mature phase)
Landfills eventually enter a mature phase. The rate of microbiological activity slows during this phase as the supply of nutrients and/or moisture limits the chemical reactions. CH4 production eventually ceases completely. Thus, the fraction of biogass that decomposes reaches an asymptote. The overall chemistry of aerobic and anaerobic decomposition of starch begins with depolymerizaton by hydrolysis, which emphasizes the need for water to start the process:
Aerobic oxidation produces CO2 and water:
A path for anaerobic decomposition of glucose can proceed as follows:
Step 1: Anaerobic Fermentation
Step 2: Hydrogen and Acetic Acid Formation
Step 3: Methane Formation
The overall anaerobic decomposition reaction is:
Note that there is also a path for aerobic decomposition that goes through C3 (propionic and citric acids) instead of C2 intermediates called the Krebs cycle [24].
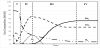
The approximate evolution of landfill gas composition is shown in Figure 7. Oxygen is consumed in Phase I, and nitrogen concentration drops as it is displaced by other gases. CO2 and water are the products of aerobic decomposition. CO2 and H2 peak at the end of Phase II and the beginning of Phase III. Methane formation begins at the onset of Stage III, and CH4 and CO2 reach steady-state levels during Phase IV. The biogas composition remains about constant, but volume declines exponentially until the landfill goes dormant. Thus, monitoring biogas volume and composition can provide information on how successful techniques to interrupt the degradation phases can be.
Landfills are now designed with underground collection systems, and the gas is typically routed to flares, and burned as a renewable fuel. Thus, the methane is converted to renewable CO2 which goes back to the atmosphere. Some landfills now route the gas to boilers for power generation (renewable power generation), or other uses. The high CO2 content of biogas makes it ripe for CO2 recovery and sequestration. CO2 sequestered from biogas would represent true Direct Air Capture.
Water is needed to first depolymerize the starch or cellulose to release the sugars that serve as food for the acid-forming and anaerobic bacteria. Thus, one key to reducing or eliminating anaerobic degradation is to keep water out, i.e., preferably to dry the biomass in drying fields, and sealing the landfill as it moves beyond Phase I.
Another way to discourage anaerobic decomposition is to exploit known inhibitors of anaerobic bacteria [25]. These include among others, pH adjustment, high concentration of alkali or alkaline earth metals, etc.
Municipal waste used to be accumulated in open piles. Modern landfills with daily, intermediate, and final covers only began in the 1940s and accelerated in the 1960s and 1970s. None of the modern landfills have gone through their full life cycle, which can take hundreds to thousands or even millions of years. The evidence is the huge mounds that are left by modern landfills that have had their final earthen caps installed and are then abandoned.
Can secure permanent sequestration of biomass carbon really be achieved? The answer is: Yes. The question is how much degradation will take place before the landfill goes dormant? Can some leakage be tolerated during the five stages? The answer is: Yes. However, it will increase the amount of material that needs to be sequestered to compensate for these losses. Some biogas can be allowed and collected and burned to generate renewable power to displace fossil fuels as is currently done at many landfill sites if economic. If not, burning or flaring the methane would convert it to renewable CO2, a less potent greenhouse gas.
Thus, secure permanent landfills are envisioned that are modifications of current landfills. These landfills may be located near the source of biomass to minimize transportation cost.
6. Sequestration of Biomass Carbon
As noted earlier, renewable energy, biofuels without CCS, and CO2 sequestration will reduce future CO2 from continued use of fossil fuels entering the atmosphere. However, it is not currently being done on a scale to achieve Net Zero CO2 while meeting current and future energy demand.
One practical way to remove CO2 already in the atmosphere is to grow biomass and remove that biomass from the Carbon Cycle by permanent sequestration.
Switchgrass grows well down into Mexico. Upland yields with shorter growing seasons may only be 1-4 t/acre/yr, but it can grow up into Canada. Using a switchgrass yield of 3.5 tonnes/acre, if 40% of that land were devoted to growing switchgrass, the CO2 capture potential would be 370 MM t/yr CO2eq. In addition, range and pastureland accounts of 27% of total land in the contiguous US, or 528 million acres [29]. If 30% of that land were devoted to switchgrass, the CO2 capture potential would be 810 Mt/yr CO2eq. These calculations are for the US. The world potential would be multi-Gt/yr CO2eq.
How much CO2 could be removed from the air by burying tree leaves? The USDA has provided allometric equations for urban tree growth parameters for many species and at numerous locations in the US [30]. The growth equations have been programmed into EXCEL files which are available in the Supplemental Input SI.1 (Supplementary File). Dry leaf biomass is calculated for most species and regions where data are available.
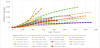
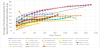
Dry leaf biomass for some species of maple trees at various locations in the US are shown in in Figure 8, as an example. Data for other tree species are provided in SI.1. Dry leaf biomass can be over 100 kg/ yr for some of the maples and over 400 kg/yr for some of the oaks depending on location and age.
Leaves currently fall to the ground and decompose every year. Assuming a very conservative average of 50 kg/yr dry weight of leaves per tree, if forests were managed, the leaves gathered and permanently securely buried, this would be about 75 kg CO2eq per tree per year.
According to the latest estimate, there are over 3 trillion trees in the world [31,32]. However, only about 30% of the trees are deciduous. At a very conservative 73 kg/yr CO2eq per tree that is the potential to remove 66 Gt/yr CO2, compared to 36 Gt/yr CO2 generated each year. Thus, theoretically sequestering tree leaves alone could provide a complete solution.
Burial of trees would add additional CO2 capture potential. Mature tree wood weights can be several metric tonnes per tree, as shown in Figure 9. However, there are several reasons that leaves may be preferred. First, most tree species take a long time to grow. Harvesting leaves instead of trees would not disrupt the forest itself. Managing new forest plantings should be considered with access provided for leaf collection.
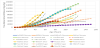
Figure 8 and Figure 9 represent calculations from the regression equations for the allometric tree growth equations provided by McPherson [30]. Twelve equation forms were used for different species and different locations, including quadratic, cubic, quartic, exponential and ln(ln). Some are not well behaved for extrapolation. Thus, they were not extrapolated beyond the limits provided. However, even within the limits, some projections showed declines in mass with age, and thus, were truncated at the point where that happened.
Figure 10 provides calculated cumulative leaf biomass as a percentage of total tree biomass generated (including tree trunk and branches) up to a given tree age. Note that the calculations show some erratic behavior from the combining of two ill-behaved correlations in some cases. Considerable scatter is observed depending on species and location. Nonetheless, this figure shows that the cumulative leaf mass can be a significant fraction of the total tree biomass generated over the life of the tree. In certain cases, the regressed percentage of leaf biomass exceeds 50% to over 70% of the total biomass generated over the life of the tree.
7. Modelling Biomass Degradation in A Normal Landfill
Steps to reduce or eliminate biomass degradation are desirable but will add cost. Are they absolutely necessary? No. Not all of the degradable biomass does degrade before a landfill goes dormant and degradation stops.
Coskuner modeled landfill gas generation in a landfill in Bahrain [33]. Using the US Environmental Protection Agency’s Landfill Gas Emission Model software [34]. The data in Table 1 and Table 2 of that manuscript allow the calculation of the fraction of decomposable waste that is predicted to decompose following landfill closure. That landfill opened in 1987 and closed in 2019. The total amount of waste deposited was about 23,000 tonnes. The MSW (Municipal Solid Waste) was comprised of 35.2% food waste, 11.6% paper and cardboard, 4.1% textiles, and 18.4% plastics.
The LandGem model assumes that methane generation can be predicted by a simple first order exponential decay:
For a full definition of symbols, see the LandGem User Guide [34].
The model has two parameters, L0 and k.
DOC=Degradable Organic Carbon.
where A is the fraction of Municipal Solid Waste (MSW) that is paper and textile wastes, B is the fraction of garden/park wastes or another non-food organic degradable waste, C is the fraction of food waste and D is the fraction of wood and straw wastes.
For the case of the Bahrain landfill, A=0.157, B=0.028, C=0.352, and D=0.018, i.e., the total fraction of decomposable waste = 0.555. The fraction of plastic film and other plastics in the MSW was 0.184. Per the US EPA model this material does not decompose, as it should not, per the stoichiometric equations for anaerobic decomposition (Equations 3 and 9), because petrochemical plastics such as polyolefins or polystyrene have no chemical path for anaerobic degradation. Other non-gradable components include metal and glass.
DOCf = the fraction of dissimilated DOC. Coskuner [33] calculated DOCf as a function of assumed landfill temperature using the formula of Alexander, et al. [33-34]. They used a value of 0.77. This value is much too high for lignocellulose biomass, such as wood, leaves, or switchgrass below.
MCF = molecular weight correction factor = (16 g/mol CH4)/(12 g/mol C).
The EPA LandGem model predicts an exponential decline in methane generation following landfill closure. Approximate CO2 generation can be predicted assuming the biogas is 50% CH4 and 50% CO2 per the stoichiometry of anaerobic degradation. Then, the mass of the biomass that has been degraded can be approximated as the sum of the mass of CH4 and CO2 generated via Equation 9.
LandGem moldel calculations for the cases in this manuscript are provided in SI.2 (Supplementary File). The LandGem model provided an exact match to the methane formation reported by Coscuner, et al. for L0= 90.59 m3/Mg and k= 0.012. (Coscuner used a value of 0.0123 for k). The LandGem output for CH4 formation through 127 years after closure were refit to an exponential decay, and then extrapolated to 300 years after closure. The cumulative CH4 make reaches an asymptote representing a cumulative fraction of degradable mass that has decomposed of only 18.0%, as shown in Figure 11. Note that this calculation assumes 55.5% of the total placed waste is degradable. However, that predicted asymptotic value of waste that decomposes is believed to be too high, based on the assumed DOCf = 0.77 as discussed below.
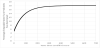
It has already been argued that decomposition of lignocellulosic biomass alone is expected to be low for two reasons: 1) the crosslinking of sugar monomers and thus dense packing make the first step of cellulose attack by water to hydrolyze difficult; and 2) wood, leaves, and switchgrass contain 20 to >30% lignin, which should not decompose [35,36]. Modeling of the decomposition of lignocellulosic biomass requires an accurate value of DOCf. There is some controversy over what DOCf should be for wood, wood products, leaves or switchgrass. The 2006 IPCC guidelines suggested using DOCf= 0.5 [37]. O’Dwyer reviewed 66 papers with information on wood and wood products decomposition [38]. Only five from the groups of Wang and Ximenes were deemed credible [39-43], and even those by the Wang group have issues. The issue is that most if not all of the studies looked at wood decomposition in the presence of municipal waste, and often the focus was on wood products like plywood, instead of wood itself. The Wang group studies estimated decomposition in laboratory reactors that were inoculated with municipal waste, which may have accelerated decomposition. Municipal waste contains much higher nutrient content and is easier to decompose than wood or leaves which could have accelerated the wood decomposition. Nonetheless, Wang reported a C loss (subject to analytical error) of only 7.8% for Eucalyptus and Red Oak, with no observable decomposition [40-41]. Only the Ximenes group estimated wood decomposition from wood samples recovered from landfills that had been buried for ≥46 years in a Sydney Park, Australia landfill and for 19 and 29 years in a Lucas Park, Australia landfill [42,43]. Ximenes reported average C loss of 17% for the Sydney Park samples (which included wood products and again is subject to analytical error), but no observable C loss for hardwood samples recovered from the Lucas Park site. From the Ximenes data, O’Dwyer estimated hardwood decomposition of only 4.5% [42]and 17.3% [43] relative to that using the 2006 IPCC guideline DOCf of 0.5 [37], i.e., 2.3-8.7% absolute decomposition and hardwood decomposition of 3.2% [42] to 18.0% [43] relative to using DOCf of 0.5, i.e., 1.6% - 9.0% absolute, without any intervention to discourage decomposition. Thus, keeping decomposition of wood, switchgrass, and leaves below 10% seem achievable, especially with intervention to discourage decomposition. More confirmation of this comes from Ning Zeng who recently posted photos of logs that had been buried 8.5 years ago in March 2013 on LinkedIn [44,45].
8. The Cost of CCS for Biomass Sequestration in a Landfill
The cost of CCS for biomass sequestration will be comprised of two components: 1) the cost of harvesting leaves, or the cost of growing and harvesting cultivated biomass such as switchgrass; and 2) the cost of landfilling.
Growing and landfilling switchgrass will be considered first. Farm- Energy estimated the cost of producing switchgrass in the US Upper Midwest at $72/mt) [46]. This assumes a conservative switchgrass yield of 3.5 ton/acre. New varieties of switchgrass are being developed that could increase yield to 6-9 ton/acre, which would lower production cost to about $28-42/mt. Statistica, indicates that the 2020 cost to landfill varies across the US from about $45/mt in the South Central region to about $81/mt in the Pacific region with a US average of about $61/mt [47]. Thus, the cost to grow and sequester switchgrass could be as low as about $73/mt switchgrass ($50/t CO2eq) in the South which includes profit for both the farmer and the landfill owner/ operator, making it a low-cost method of Direct Air Capture of CO2.
The cost for harvesting and bailing hay is well known [48]. The cost for harvesting tree leaves would have more uncertainty. Harvesting leaves from established forests would have no growing costs, and thus, zero net raw material cost. However, harvesting costs would be expected to be higher for leaves due to lower compacted density. The density of hay is about 150-250 kg/m3 [49], compared to a density of about 113 kg/m3 for compacted leaves. The latter value is from a private email dated April 27, 2021, from the Commissioner of Streets and Sanitation for the city of Batavia, Illinois.
Of course, biomass gown on-purpose should not be limited to switchgrass. High yield trees, such as the empress tree (Paulownia fortunei and Paulwnia elongate) grow extremely fast and have a yield the equivalent of 130 tons CO2 per acre [50]. Harvest time can be within 10 years.
The cost for biomass sequestration will now be compared to the cost of CO2 sequestration from other processes. First, one issue for decarbonization by CO2 recovery, whether it be recovery of CO2 from fermentation, from hydrogen production by the Steam Reforming of Methane (SRM), or recovery from large point sources such as large industrial furnace stacks is what to do with the recovered CO2. CO2 has value for certain markets, such as carbonation of beverages and tertiary oil recovery. However, the markets where CO2 have value are small compared to the current 36 giga tonnes/yr (Gt/yr) generated. Beyond those markets, recovered CO2 has negative value, and CO2 must be stored underground in spent oil or gas wells or in saline aquifers.
A 2005 US Energy Information Authority (EIA) report estimated that the markets where CO2 has value extend to about 700 million metric tonnes per year (Mt/yr), well below the approximately 35 Gt/ yr total generation [51]. EIA identified geological formations having a total storage capacity of about 3800 Gt CO2, which is enough storage capacity to store all of the CO2 generated for many years to come. However, underground storage comes at a cost. The mean cost for storage in deep saline aquifers was estimated to be about $12.5/t CO2 in 2005, which is $17/t CO2 in 2020 when escalated using the US Consumer Price Index (CPI). However, this estimate seems low based on a few recovery projects.
There are a few new projects to capture and store CO2 from bioethanol plants. ADM has one in operation in Illinois [52]. That project cost $208 MM, with 68% paid by the DOE, and was designed to capture about 1 million short tons CO2 per year. The captured CO2 is stored underground in a saline aquifer nearby, so minimal pipe distance was required. With actual plant operating factor of about 80%, it is capturing about 728 metric tonnes per year (Mt/yr). The simplest way to express a capital charge is as an annuity at x percent interest rate for y years. In this document, this will be referred to as a “x% PI, y year capital charge.” Note this is independent of taxes and any government incentives, and thus is a good representation of the true cost. Project life and interest rate are variables set by investors in projects. The cost of capital for a corporation can be calculated from corporate balance sheets. A corporation’s acceptable project return rate for them to invest in a project is generally greater than their cost of capital. For the ADM project, with a conservative interest rate, the 6% PI, 20 yr year capital charge is $24.5/metric tonne CO2. A 10% PI, 15 yr capital charge would be $36.9 / metric tonne. This does not include the cost of energy for compression and transportation.
Other announced projects for CO2 capture from bioethanol plants include the Summit Agricultural Group and Green Plains, Inc. project to capture CO2 from several bioethanol plants in Iowa, Minnesota, and North and South Dakota with CO2 storage in a saline aquifer in North Dakota [53], and a planned 1200 mile CO2 pipeline (not yet a CO2 capture and storage project) by Valero and Blackrock that will span the Midwest designed to send up to 5 Mt/yr CO2 to storage in a saline aquifer in southern Illinois [54]. The Summit Carbon Solutions pipeline is currently estimated to cost $4.5 billion and will capture only 10 Mt/yr CO2 from about 15% (not 100%) of US bioethanol plants. Total CO2 pipelines currently planned will have a capacity of only 56.8 Mt/yr out to 2050 [55]. These projects are expensive which reemphasizes the need for other solutions. The true costs may not be known until project completion, since cost overruns for new technologies are common.
Now consider the cost of CO2 recovery from hydrogen production by the Steam Reforming of Methane (SRM). Roussanaly et al. calculate the cost of CO2 avoidance by capture using a monoethylamine (MEA) solvent followed by CO2 stripping from the solvent by distillation and indicates the cost can be project specific and depends on the energy source used to strip (such as an electric versus steam reboiler) [56]. The distillation step is energy intensive. Soultania et al. calculated the minimum energy required for the stripping step alone is 3.98 GJ/t CO2 [63]. Stripping is usually done using a steam reboiler. The steam must be generally produced in a boiler, which incurs its own energy and capital cost. Assuming $4 US/MMBTU for natural gas, and a boiler with 95% efficiency, the energy cost for stripping alone is $15/t CO2, and that would scale with natural gas price. Roussanaly put the total cost of CO2 avoidance via MEA at from $60-150/t CO2 [56]. Again, actual cost will be project specific and will not be known until project completion.
9. Secondary Issues and Practicality
The main secondary issues include:
- For leaf gathering, the main issue is accessibility. While theoretically, there are enough leaves in the world to achieve Net Zero CO2 if they were gathered and sequestered, trees are distributed with many in remote areas that are not accessible. Reforestation is a popular current topic. New forests should be planted structurally with leaf gathering in mind.
- Resupply of nutrients pulled from the ground is another issue. As noted above, plants receive all of their carbon from CO2 in the air via photosynthesis. However, the enzyme that catalyzes photosynthesis requires nitrogen and phosphorous. For trees in mature forests, those can come from decomposition of leaf and dead trees. In addition to N, P, and K, there are other micronutrients such as B, Fe, etc. There is nothing in the list of nutrients that cannot be supplied by external fertilization with a proper mix. Note that natural forests are sustainable without external fertilization. There are nitrogen fixing plants, such as soybeans and clover. Crop rotation between corn and soybeans is practiced reducing the need for external fertilization. Also, nitrogen fixation is carried out naturally in soil by microorganisms termed diazotrophs that include bacteria such as Azotobacter and Archaea. Perhaps research and commercial development of these bacteria could lessen fertilizer requirements. Red clover has also been suggested as a good nitrogen fixing plant for crop rotation [57].
- For growing switchgrass on US western pastureland, a secondary issue will be water, as this area continues to be under severe drought conditions. There are drought tolerant plants. Plants respire some water. There is a difference between plants that have a C3 or a C4 mechanism for photosynthesis with C4 plants requiring less water [58]. Empress trees have been mentioned as possible high yield sources of biomass and they require little water.
Would it be practical to achieve full Net Zero CO2 (35 Gt/yr CO2 removal) by sequestering tree leaves and growing and sequestering high yield crops such as switchgrass or empress trees? The answer is likely not. However, these methods can play an important role in supplementing energy conservation, renewable energy, and CO2 sequestration from existing and future large point sources. CO2 removal on a Gt/yr should be possible.
The issue of practicality will be addressed in two ways: 1) The volume of leaves and switchgrass that would need to be sequestered to pull 1 Gt/yr CO2 from the air will be compared to the volume of coal that is currently removed from the ground each year; and 2) The practicality of pulling an equivalent amount of CO2 from the air by sequestering biomass will be compared to the amount of CO2 that may be removed by low-carbon hydrogen production installed, announced and in the Sustainable Development Scenario of the IEA for the period 2010-2030 [59].
Historical data provided by IEA indicates that world annual coal production peaked at about 8 Gt in 2013, and after a dip to about 7.3 Gt in 2016 recovered to about 7.9 Gt in 2019 [60]. Using 8 Gt/yr and an average compacted coal density of 881 kg/m3 (the average-e for anthracite and bituminous) [61], that is about 9 billion m3/yr. The average compacted density of leaves is about 113 kg/m3. The ratio of coal to leaf density is about 7.8. Thus, burying 1 Gt/yr of leaves (about 1.5 Gt/yr CO2eq) would occupy about the same volume as the amount of coal mined in 2013. Remember that the amount of CO2 removed from the air for burying 1 Gt leaves or other biomass is about (44.01 gm/mol CO2/30.03 gm CH2O) = 1.47 t/yr CO2eq. Thus, achieving 1 Gt/yr reduction of CO2 by burying leaves seems within the realm of possibility. The density of large round hay bales is about 177 kg/m3 [62], and switchgrass density should be about the same. Thus, the ratio of coal density to hay density is about 5. Thus, burying 1 Gt/yr of switchgrass (about 1.5 Gt/yr CO2eq) would require about 63% of the volume of coal mined in 2013.
IEA has provided a recent update of low-carbon hydrogen production projects, installed, announced and in the IEA Sustainable Development Scenario, for the period 2010-2030 [59]. Through 2019, only about 0.4 Mt/yr low-carbon H2 has been installed, total announced projects through 2023 are only 1.4 Mt/yr, and total in the plan through 2030 are only 7.9 Mt/yr H2. From a Steam Reforming of Methane (SRM) hydrogen plant material balance 1 Mt/yr H2 equals about 9.2 Mt/yr CO2eq [64]. Thus, the equivalent amount of CO2 capture for low carbon H2 plants in the plan through 2030 is only 73 Mt/yr CO2. This is Mt/yr, not the Gt/yr needed to achieve Net Zero CO2. While there are high hopes for a hydrogen economy contributing to the reduction of CO2 emissions, we are currently a long way away.
For another perspective on the effort required to achieve substantial CO2 removal by biomass sequestration, consider the infrastructure that has been put in place to produce and refine oil, most occurring since the 1950’s.
10. Summary and Final Comments
Here are some final comments regarding the proposed permanent biomass sequestration as a means of Direct Capture removal of CO2 already in the atmosphere.
- Theoretically can it achieve Net Zero CO2? Yes, there are enough tree leaves, and on-purpose growth of switchgrass or pother biomass can achieve Net Zero on its own independent of other technologies.
- Is it technically sound? Yes. Landfills can be designed to prevent biomass degradation to CO2 and/or methane. In fact, encouraging degradation in bioreactor landfills is actually a more difficult problem. Little degradation has been shown to occur even without intervention.
- Is it actionable? Yes. It could be put into practice in the timeframe required (before 2030-2050).
- Are there secondary issues? Yes, as discussed above. However, none of these issues can be overcome.
- The potential for carbon capture via biomass sequestration is enormous, greater than Gt/yr.
- Is it still a daunting problem? Yes. To achieve Net Zero CO2 for the current 36 Gt/yr of CO2 using this technique alone would require sequestering an enormous amount of material. Of course, this would be reduced, perhaps in half, by energy conservation, renewable energy, CO2 sequestration from large point sources, other carbon capture innovations, etc. Even at incomplete implementation, it can play an important role in reducing net CO2 to the atmosphere.
- Can any of the other current proposed technologies achieve Net Zero CO2 on their own? No.
- How would biomass landfill projects be funded? CO2 sequestration by any means will incur cost. That is reality. It will take a government mandated cost of carbon and tax incentives. The business model for this proposal would be the following. Corporations would invest in the landfills and leaf or biomass growth and collection. Farmers would grow high yield crops for carbon sequestration and would be compensated for their efforts. Carbon credits would be sold to recover investments.
Competing Interests
The author declares that there is no competing interests regarding the publication of this article.