


1. Introduction
Forest soils play a significant role in the emission and sinking of greenhouse gases. For example, between 20% and 40% of CO2 released by forests occurs because of various processes within the forest soils [1-5]. Forest soils also are a significant factor in the overall respiration of methane, CH4 [6-9]. Soil respiration mechanisms for both CO2 and CH4 in forests and other areas are largely the result of microbial activity in the near-surface regions of the soil. Recently, forest wildfires have become a more significant factor worldwide, potentially owing to certain climate change factors in some regions. The direct economic damage of these fires has reached unprecedented levels in the US. Forest wildfires not only are devastating structures as well as plant and animal life within the forest, but also may significantly affect the microbial activity and soil respiration of gases within the soils. Depending on the heat and intensity of a wildfire, soil microbes may be reduced or eliminated altogether. Secondarily, the destruction of forest trees, shrubs and grasses will also have an effect of the food sources for the soil microbes. These effects will alter respiration from the soils for potentially years or decades after a wildfire [10-12].
Overall soil microbial activity is a function of several different factors. Some of these factors include short-term and long-term temperature variations [13-16], nitrogen abundance within the soil, availability of forest litter for decomposition by the microbes, water and water vapor levels within the soil, as well as other possible factors [6,17-19]. In the case of temperature variations, strong correlations with atmospheric temperature and soil CO2 flux have been studied. Here, observed maxima of flux and temperature were reported to be out of phase. It was also reported that atmospheric temperature and near-surface soil temperature were also highly correlated, possibly indicating that soil CO2 activity was occurring in the very near surface regions of the soil [14]. The respiration of CO2 owing to soil nitrogen availability has also been previously reported. Factors that alter the amount of available nitrogen such as nitrogen deposition, litter decomposition, drought, fires, forest thinning, and other mechanisms may play significant roles in CO2 production. In soils where the nitrogen level is greater than normal, microbial populations and activity are reduced, leading to reduced respiration and increased CO2 sequestration. The reduction in carbon emissions may be near the same level of carbon taken up by the forest trees themselves as a result of nitrogen addition [16].
Water and water vapor in the forest soils may also play a major role in both CO2 and CH4 respiration owing to soil microbial activity. In studies within ponderosa pine forested areas, CO2 efflux was found to vary according to seasonal changes in soil moisture content and soil moisture content changes owing to forest thinning [20]. We have also previously observed a similar reduction in near-surface CO2 concentration as a function of measured H2O vapor concentrations [21]. Reports also show that soil moisture conditions in which the soil water content is higher than optimal conditions may result in a reduction of overall soil respiration [17]. A negative correlation between excess soil H2O content and soil temperature was observed. Carbon dioxide respiration is also affected by the availability of forest litter or biomass for decomposition by soil bacteria. Previous studies have shown that a linear relationship between available forest litter and biomass for decomposition and levels of CO2 efflux exists [22].
CH4 respiration is also potentially affected by soil moisture. CH4 efflux from forest soils has been shown to occur as microbes digest carbon contained within decaying forest biomass [23]. This efflux may be highly correlated with soil H2O levels. Interestingly, the production of CH4 by soil microbes may be enhanced as soil H2O levels are reduced [24]. In the case of H2O reduction, oxidation of CH4 is reduced, making larger amounts of CH4 available to percolate into the atmosphere. Looser soil compaction may also be sometimes correlated with lower levels of H2O within the soil. In this case, CH4 efflux out of the topmost soil regions may be further enhanced. Major forest wildfires have also been shown to reduce CO2 efflux and increase CH4 uptake owing to a number of different mechanisms [25]. Isoprene is another greenhouse gas produced in large amounts by forest plant and tree growth [26]. Soils in forests and other environments break down isoprene through microbial activity in the soils. Actinobacteria and Proteobacteria species have been found to break down isoprene in forest soils. Measuring the relative levels in isoprene in forest soils may be directly a measure of microbial activity, providing a future yardstick for directly measuring the levels of microbial activity.
2. Materials and Method
The electron-impact quadrupole mass spectrometer instrument has been previously described [27]. It is a portable, battery-powered unit designed and constructed by us. This instrument fits inside a medium-sized case, weighs approximately 30 lbs., and can be easily hand carried. Components of this instrument include a miniature quadrupole residual gas analyzer (RGA) provided by Horiba, a diaphragm roughing pump and a high-vacuum miniature turbomolecular pump provided by Balzers, and a generic small dronesized lithium-ion battery with associated DC-DC converter circuitry for overall system operation. Pirani pressure gauges are also attached to the mass spectrometer vacuum system to constantly monitor system pressure. Software for the instrument system is facilitated by a laptop computer interfaced to the mass spectrometer through a serial port. The software allows for full instrument control as well as data collection and storage. The instrument gas sample stage is designed with a differentially pumped gas inlet dual orifice system that enables real-time measurement of gases under fully ambient conditions. The two micron-scale orifices are used to isolate the high vacuum region more completely from the atmospheric region. In a typical field measurement, the system is placed on the ground and the roughing diaphragm pump is first turned on. After a few minutes of rough pumping the system is brought down to approximately 1-3 x 10⁻³ Torr. At this time, the turbomolecular pump may be initially turned on. The turbo pump then pumps the system for 15-20 minutes, at which time the total system pressure is typically pumped down to the low 10-6 Torr pressure range or better. During this time, the sample stage has already been situated in the ground at the location to be measured and is allowed to come to pressure equilibrium. After sufficient high vacuum is achieved, the quadrupole RGA may be turned on and measurements begun.
For the soil gas measurements, in each sampled area a small hole, approximately 1 cm diameter, was punched 4 cm into the soil. The inlet probe to the mass spectrometer was inserted approximately 2.5 cm into the hole, with a snug fit around the cylindrical input probe. The ground level was sealed by outside pressure using a 3.4 cm diameter steel flange. With the inlet probe sealed in place, the pumping system was started as described above, and tiny amounts of air within the soil-probe area begin to be drawn into the system. The system is pumped to come to vacuum equilibrium for 15-20 minutes, after which the quadrupole analyzer was switched on and readings were taken.
3. Results and Discussion
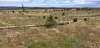
We compare the relative concentrations of CO2, CH4, H2O vapor, and, in some cases, isoprene found in the near-surface soils of burned forests with concentrations of those same gases in pristine, unburned forests. These comparisons are all within the Coconino National Forest in Northern Arizona, the largest ponderosa pine forest in America. In this forest, there are many different varieties of plant life, including ponderosa pine, pinion pine, limber pine, aspen, Gambel oak, Douglas fir, white fir, sub-alpine fir, cork bark fir, Engelmann spruce, blue spruce, alligator juniper, rocky mountain juniper and Utah juniper. Under the tree canopies, there are generally four plant groups - tree seedlings/saplings, shrubs, forbs, and graminoids. In the current area, this vegetation includes bouteloua curtipendula, poa fendleriana, eriogonum alatum, potentilla hippiana, and pseudocymopterus montanus. Also present were small weed species such as dalmatian toadflax and diffuse knapweed. The trees and brush contribute to the total biomass available within the forest. In the Coconino National Forest, the total available biomass from trees is split into two primary groups, standing trees and dead trees. For the dead trees, there are approximately 17.8 dead per acre. Within the category of dead trees, 59 percent are between 1 inch and 4.9 inches diameter, with nearly two-thirds of these occurring within the ponderosa pine forest type. Biomass immediately available for the soil, and microorganisms within the soil consists of dead, decomposing trees as well as the more standard leaves, needles, dead brush, and other forest litter. During wildfires, it is this available biomass for the soil microorganisms that may be largely destroyed during the burn. Figure 1 shows an area of the forest within the 2010 Shultz fire area of the Coconino National Forest, while Figure 2 shows an area within the Shultz Oasis region in 2021. The effects of this 15,000-acre fire were devastating to life in this region. As the photograph in Figure 1 shows, in the 11 years since the fire forest regrowth largely consists of small tree saplings, many of which were planted by forest personnel, and grasses and small shrubs. Within the Shultz Oasis region of this major fire, many of the existing trees were spared, while only the lower dried vegetation was burned. Finally, Figure 3 shows a representative region within the 2016 Cowboy wildfire region of the forest. In this area, most or all the forest life was burned or destroyed. Compared to the 2010 Shultz fire, there has not been sufficient time for larger amounts of the soil level grasses to regrow.


In Table 1 below, we show the measurement results for the CO2, CH4, and H2O vapor for the soil areas studied. These areas include pristine, untouched forest, Shults fire forest, Cowboy fire forest area, and the small, only partially burned area within the Shultz area which we previously referred to as the Shultz Oasis area.
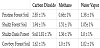
These readings from the quadrupole mass spectrometer are relative readings, indicating the indicated gas concentration relative to mass spectrometer readings taken minutes before soil readings in the free atmosphere of the indicated forest area.
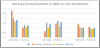
Note that we use relative gas ratios or factors owing to the general nature of this type of mass spectrometer. Residual gas, or partial pressure measurements from an electron-impact quadrupole mass spectrometer are generally not true partial pressures. What these instruments measure is peak detector electron currents at the various masses. Factors such as electron impact ionization probabilities for different gas molecules, molecular fragmentation fractions, and other factors would need to be calculated for each mass detected. Thus here, we rely primarily on comparisons of relative soil gas concentrations with readings taken in the atmosphere in the same region. The measurements shown in Table 1 were taken in July 2021, during the seasonal monsoons. The areas under study had received positive rainfall in 5 of the previous 10 days. We have followed a similar seasonal timeline in previous studies to have consistent measurement parameters with regard to temperature, rainfall, and humidity. In addition, we have also taken measurements of the same forest areas prior to the monsoon season. For direct comparisons, we have data shown in Figure 4 from approximately two months prior to the seasonal monsoons.
Looking first at relative CO2 levels from Table 1, we see that the soil level of CO2 in the Shultz burn area is 32% below that measured for the pristine forest. In the Shultz Oasis area, the soil CO2 level is 37% lower, while in the Cowboy wildfire area it is 43% lower. We can directly compare these CO2 concentrations with measurements taken 4 years prior at the same locations. Earlier data showed the soil level of CO2 in the Shultz burn area was 30% below that measured for the pristine forest. In the Shultz Oasis area, the soil CO2 level was 56% lower, while in the Cowboy fire area it was 40% lower. While the Shultz and Cowboy CO2 levels are very close to the levels measured 4 years prior, the Shultz Oasis CO2 level in 2021 has risen by 19% relative to the pristine forest CO2 levels. We also note that the soil water vapor concentrations in 2021 are measurably lower than they were in 2017 by over 30%, except for the Shultz Oasis location, where the 2021 water vapor level in the soil is less by only approximately 15%. In general, CO2 respiration in forest and other soils is driven by soil-based microbial activity. This microbial activity may be affected by environmental factors such as nitrogen abundance, litter decomposition, drought, fires, forest thinning, and other mechanisms. Water and water vapor in the soils are a major factor in the overall levels of soil microbial activity. Looking at work by other groups in ponderosa pine forested areas, overall CO2 efflux was found to vary according to seasonal changes in soil moisture content and soil moisture content changes. In the current study, it is possible that the lower levels of moisture content in the soils measured in the Shultz and Cowboy wildfire areas has resulted in a concomitant decrease of soil microbial activity and subsequent CO2 production even though the overall level of forest vegetation has shown a small observed increase over the 4-year period. In the Shultz Oasis area, the measured 2021 soil water vapor content is only slightly lower than in 2017, and with an overall modest increase in forest vegetation and biomass in this area the CO2 levels have shown an increase.
Methane soil levels relative to atmosphere in the Shultz, Shultz Oasis, and Cowboy areas were higher than those in the pristine forest across the board. Here, the relative CH4 levels were 129%, 106%, and 52% higher respectively in the three burned areas. Soils may act as net producers of CH4 as the topmost layers of the soil lose moisture. Explanations for this include that the largest natural process leading to CH4 removal in the soils, oxidation of CH4, is reduced as the soils dry out. Other potential reasons include reduced oxidation of CH4 as a function of moisture loss and degradation of the bacteria, and more rapid diffusion of CH4 from deeper soil layers owing to water loss in the soils. As was the case with measured soil CO2 levels, soil moisture and water vapor content may be the single most important factor regarding the production or sinking of CH4 within these forest soils. As previously mentioned, earlier in 2021, we measured soil gas concentrations vs. atmospheric gas concentrations. During this month of May, which is prior to typical Arizona monsoons, forests exhibit drier conditions in the soils. We have compared them with gas concentrations at the same locations in July, after monsoon activity had begun and soil moisture had increased (Figure 4). In all cases, soil H2O vapor was less in May than July, although in the Shultz Oasis area that difference was very small.
Referring to Figure 4, we can see that CO2 levels in the Shultz, Shultz Oasis, and Cowboy wildfire regions were all lower than CO2 levels in the same areas in the wetter month of July. Conversely, CH4 levels in all three areas in July were all larger respectively than in the drier month of May. Over the longer term as more data is collected, we may be able to reliably correct yearly measurements of soil greenhouse gases with respect to measured soil humidity levels. This would allow us to more accurately track the recovery of forest soil respiration in the years following a major wildfire.
Finally, as an additional potential measuring stick for future comparisons of soil microbial activity, we have taken an initial set of isoprene measurements in the soils of the wildfire areas. These are shown in Table 2.

Isoprene is a liquid, but highly volatile. At room temperature, however, it is found in its gaseous state. Isoprene is produced in large amounts by vegetation in forests and other areas where plant growth is occurring. Among the gases produced or sinked in forest soils, isoprene is highly volatile and may serve as a marker for the overall level of microbial activity in the soil. Bacillus, and its relatives, produce large amounts of isoprene along with the forest plants themselves, while other bacteria such as Actinobacteria and Proteobacteria species may act to consume isoprene. In future studies, the overall level of soil microbial activity may be found to correlate with the measured levels of soil isoprene vs. atmospheric levels.
4. Conclusions
Relative levels of the greenhouse gases CO2, CH4, and isoprene have been measured in wildfire areas within the Coconino National Forest. Compared to soil gas levels in untouched, pristine forests, soil CO2 levels were found to be higher in the burned areas. In the case of CH4, the reverse was true, with levels of CH4 lower that those found in unburned forest areas. Both results may be correlated with differences in soil H2O vapor concentration. Here, H2O levels that are higher may result in greater CO2 production by soil bacteria, while lower H2O levels result in higher soil CH4 relative concentrations. This result is further supported by soil gas measurements taken in the dry season of 2021, prior to one onset of the wet monsoon season. We have also obtained baseline measurements of soil and atmospheric isoprene to use for future comparisons of the levels of forest soil microbial activity.
Competing Interests
The authors declare that they have no competing interests.