


1. Introduction
Soil is widely known to be a major reservoir of soil organic carbon (SOC) and soil organic nitrogen (SON), which plays an important role in reducing CO2 in the atmosphere, hence regulating the global carbon cycle and climate system [1]. In addition, SOC also helps in maintaining soil fertility and environmental quality [2-4]. Recently, with increasing anthropogenic activities and climate change, the spatial and temporal variation in SOC has gained much attention [4,5]. The tropical and subtropical region of southwestern China is one of the largest continuous karsts in the world, and had experienced significant environmental degradation in the twentieth century [6]. In particular, the Yunnan karst region-Guizhou (Y-G) is approximately 42.6 × 10⁴ km2 with a population of approximately 100 million people [7]. Due to anthropogenic activities, such as agriculture, deforestation, mining and construction of roads, the area is exposed to severe soil erosion and rocky desertification [8]. Studies have reported that anthropogenic activities affect SOC, SON storage, greenhouse gas emissions, inorganic N loss, and soil structure [9]. However, little information is known on carbon and nitrogen dynamics within karst rocky desertification areas. Hence, it is important to fully understand the spatial temporal variation and behaviour of soil C and N within this environment.
Stable isotopes of carbon and nitrogen are often used by researchers to determine the origin of soil organic matter [10] as well as processes that govern cycling [11-13,9,14]. In terrestrial karst ecosystems, several researchers successfully used stable carbon isotope signature in soils to identify sources and turnover of SOC [15,16,9]. Terrestrial plant groups have different photosynthetic pathways that registered distinct isotopic signatures. For example, C3 plants (Calvin-Benson cycle) [17] and C4 plants (Hatch-Slack cycle) [18]. The δ13C value of SOM from present vegetation cover consists of C3 and C4 plant δ13C values between the ranges of -23‰ to -30‰ (avg. -27‰) and -9‰ to -17‰ (avg. -13‰) respectively [17]. Therefore, C3 and C4 plants have distinct δ13C values which differ from each other by approximately 14‰ [17]. However, the decomposition of soil organic matter by microbes can alter fractionation and complicate the contribution of C3 or C4 plants, thereby hindering the accurate interpretation of SOM sources and estimation of its turnover [19]. At present, stable carbon isotope has been widely used and studied across several ecosystems e.g. natural forest, artificial forest, grassland, shrubland, farmland and wetland [4,9]. In addition to understanding the behaviour and biological fractionation, the study of carbon and nitrogen dynamics in upland karst rocky desertification area is also critical as it may provide tighter constraints on carbon-dynamic model having biological and environmental significance [20,14]. Stable isotope (δ13C and δ15N) techniques and C/N ratios are robust tools that have been commonly used to determine sources, mixing and transformational activities in terrestrial, estuarine and coastal systems [21-23]. Since the magnitude and the direction of changes in SOM decomposition are still unclear in ecologically fragile upland karst desertification areas, our study aims to use δ13C and δ15N along with C/N ratio to (1) investigate the source of soil organic matter, (2) determine the change in C3 and C4 plants proportion, and (3) examine the behaviour of C and N and factors affecting SOM decomposition in the Yunnan upland rocky karst desertification area -Guizhou Plateau, southwestern China.
2. Material and methods
2.1 Study area
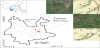
The study area is located in Yunnan Province (24°30'-25°03'N, 103°10'-104°40'E) (Figure 1). The topography, mainly, is comprised of highlands in the east and low mountains towards the western region. The area experiences a typical subtropical monsoon climate with warm-humid conditions from May to October and cold-dry conditions from November to April. The region average annual temperature is approximately 16.3°C, with large temperature difference between the day and night [24]. The average annual precipitation ranges between 800-850 mm, with almost 70% occurring during the wet season. The typical characteristic feature of the area is karst mountain landform, with few exposed limestone rocks and thin soil deposit. The soil types are characterized as red soil and limestone soil [25-27] and classified as Mollic Inceptisols [28]. The dominant lithologies in the area are mainly Limestone of Permian period, Limestone and Dolomite of Middle-Lower Cambrian and Slate, with Limestone of Sinian period. The soil in the area is susceptible to erosion and water loss as there is limited means of protection from the sparsely stunt vegetation cover resulting in severe rocky desertification.
2.2 Soil profile and sampling
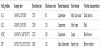
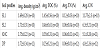
The study sites were selected through indoor research and field surveys, sites with similarly high upland elevation, with limestone bedrock, and affected by different degree of rocky desertification and human interference were selected. Four typical soil profiles located in upland landform were identified and labelled as SL1, SL2, XNC and DP over carbonate bedrock. The location, elevation, thickness and the visible characteristics of the soil profiles are described in Table 1.
Shilin Scenic Area 1 (SL1) soil profile is located in the undeveloped section of Shilin near the Stone Forest scenic area at an elevation of 1770 m, with GPS coordinates of 24°48'N; 103°18'E (Figure 1, Table 1). The sampling point is located at the top of the hill, with a relatively flat terrain and the immediate surrounding strata is bare. However, the surrounding vegetation cover is relatively high and mainly consists of shrubs and herbaceous plants. Some of the plant species include Ligustrum lucidum, Eucommia ulmoides and Artemisia annua. Fresh soil samples were collected at an interval of 5 cm from top to bottom of the profile. The samples were numbered and labeled from SL1-1 to SL1-10, respectively to a maximum depth of 50 cm. The dominant bedrock was Limestone of Permian period and the bedrock sample (SL1-0) collected at 100 cm. A total of 10 soil samples with soil bulk density ranging from 1.14 - 2.04 g/cm3 were collected (Table 2).

Shilin Scenic Area 2 (SL2) soil profile is located at an altitude of 1730 m, 24°48'N; 103°18'E (Figure 1, Table 1). The SL2 sample profile is located on a steep hillside slope. The surrounding area comprised of bare rocks with relatively low vegetation cover consisting of predominantly shrubs. Some of the common plant species include Ligustrum lucidum, Pinus massoniana, Eucommia ulmoides, Pinus elliottii, and Artemisia annua. The soil profile is naturally developed and without any visible sign of human disturbance. Fresh soil samples were collected at an interval of 12 cm from top to bottom of the profile. The samples were numbered and labeled from SL2-1 to SL2- 10, respectively to a maximum depth of 113 cm. Limestone bedrock sample (SL2-0) was also collected at 163 cm. A total of 10 soil samples with soil bulk density ranging from 1.16 - 2.30 g/cm3 were collected (Table 2).
The Xinacun (XNC) soil profile is located at an elevation of 1720 m (24°49'6"N; 103°18'37"E) (Figure 1, Table 1), on a mountain slope close to a road construction site. This sample profile was a vertical man-made section established by an excavator. The upper surface of this profile comprised of weeds, shrubs and tall trees with loose soil containing plant roots and black humus. The dominant plant species were mainly Pinus massoniana, Eucommia ulmoides, Pteridium aquilinum, Miscanthus floridulus and Imperata cylindrica. No bedrock was present in this excavated soil profile. However, the underlying bedrock was found in close proximity and identified as Limestone and Dolomite of Middle-Lower Cambrian. Fresh soil samples were collected starting at 10 cm, intervals from top to bottom of the profile. The samples were numbered and labeled as XNC-1 to XNC-11, respectively to a maximum depth of 245 cm. A total of 11 soil samples were collected with soil bulk density ranging from 1.4 - 2.11 g/cm3 (Table 2).
The Dapo (DP) soil profile is located at an elevation of 1920 m (24°50'21"N; 103°23'26"E) (Figure 1, Table 1) in the lower gully region of the upland landscape. The area comprised of thatched grass, few shrubs and small number of coniferous trees. The underlying bedrock of this profile is Slate, Phyllite, Siltstone intercalated with Limestone of Sinian period. Fresh soil samples were collected at an interval of 10 cm from top to bottom of the profile. The samples were numbered and labeled from DP-1 to DP-10, respectively to a maximum depth of 115 cm. The bedrock sample (DP-0) was also collected at 145 cm. A total of 10 soil samples, with soil bulk density ranging from 1.13 - 2.08 g/cm3 were collected (Table 2).
Each studied soil profile has different depth varying in thickness and ranging from 50-245 cm. In order to captured and represent the changes, soil sampling was done according to the genetic horizons of each profile. Hence, soil samples were collected at varying intervals, however all the soil profiles were chosen with thickness >50 cm so as to compare the changes of TOC and TN contents and their stable isotope compositions with depth.
2.3 Soil preparation and analysis
All soil samples collected were naturally air dried at room temperature and impurities such as plant roots, gravel, and other debris were removed. Soil samples were later ground and pass through a 200-mesh size sieve to remove larger fragments. The samples were then placed in zip lock bags for later determination of total organic carbon (TOC), total nitrogen (TN), C/N ratio, nitrogen and carbon isotopes (δ15N and δ13C).
The soil pH values were determined by the “China agricultural standard - soil pH determination” (NY-T 1377-2007). The total soil bulk density was determined based on “NF X31-510-1993” soil quality and the paraffin coating method. The powder soil sample was pretreated with 1mol/L HCl, and the carbonate minerals were removed [29]. The inorganic N were removed using 2 mol L-1 potassium chloride (KCl) for 24 hours [30]. The samples were washed with deionized water until the supernatant liquid pH value was neutral and then later dried at 60°C. Approximately 100 mg of sieved dried soil sample was used for analysis of TOC, TN and stable isotopes contents. The TOC and TN contents were calibrated due to loss of carbonate and inorganic N respectively. The TOC and TN contents were determined by using an elemental analyzer (Elementar, Vario TOC cube, Germany) with a precision of C ± 0.1% and N ± 0.02%, monitored with standard samples. The stable carbon isotope ratio (13C/12C) and stable nitrogen isotope ratio (15N/14N) were determined by using the gas isotope ratio mass spectrometer (MAT-252, Germany). Testing was done by the State Key Laboratory of Environmental Geochemistry, Institute of Geochemistry. The measurements were normalized according to international standards material (δ13CVPDB: 45.6‰ ± 0.08‰; δ15NAir: 0.24‰ ± 0.13‰), and expressed as delta value (δ13C and δ15N) notation (‰) relative to Vienna Pee Dee Belemnite (VPDB) and atmospheric air, respectively, whereby: δ13C (‰) = [(15C/12C) sample - (13C/12C) standard] / (13C/12C) standard × 1000 and δ15N (‰) = [(15N/14N) sample - (15N/14N) standard] / (15N/14N) standard × 1000. Measurements of δ13C and δ15N were conducted routinely with a precision of ±0.1‰ and ±0.2‰, respectively. Samples were analyzed in duplicate with result differences within the range of measurement accuracy according to the standard material measured values.
2.4 Statistical analysis
All statistical analyses were performed by Origin 8.5 (OriginLab, MA, USA). The relationships among the parameters TOC, TN, C/N, δ13C and δ15N contents with soil depth, soil pH, clay proportion and soil bulk density were determined by linear regression analysis.
3. Results
3.1 Vertical distribution of soil physicochemical properties in soil profiles
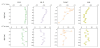
As illustrated in Figure 2 the pH values of the studied soil profiles vary from 4.05 to 6.09, which are slightly acidic in nature, however DP soil profile tend to be more acidic with average pH value of 4.23 (Figure 2d). There were slight fluctuations in pH values with increasing soil depth, with the upper soil surface being more acidic than rest of the profile except for SL1 and DP soil profiles. The soil bulk density ranges from 1.13 g cm-3 to 2.30 g cm-3 with DP and SL2 profiles recording the lowest and highest soil bulk density respectively (Figure 2). The high soil bulk density recorded in SL2-7 correspond to high sand content (45%) and low clay content (9.1%). The TOC content within the studied soil profiles showed high variation with soil depth with a general decrease from upper soil surface to lower layers down to bedrock (Figure 2). The TN content tends to vary with soil depth for the studied soil profiles. Generally, there seem to be a decrease in TN with increasing soil depth (Figure 2). The SL1 soil profile is notably higher in TN content in comparison to the other profiles. SL1 profile immediate surrounding vegetation consists of mainly shrubs and herbaceous plants which may account for the relatively high TN content as well as the rearing of animals in the area.
The studied soil profiles C/N values have high degree of variability, with values ranging from 1.5 (XNC) to 13.4 (SL1) with an average of 6.60±4.02. The general trend indicates a gradual reduction in C/N values from the topsoil to the bottom of the soil profile layer (Figure 2). There is an obvious difference in the upper topsoil C/N ratio of all studied soil profiles (>10), which may indicate that plant residues or animals input contributes to the relatively high C/N value in the upper soil surface. The degree of human disturbance or interference may also influence the migration and transformation of nitrogen, resulting in C/N variation at different layers within the soil profiles. Table 2 also shows the clay proportion depth distributions of the four studied soil profiles. All soil samples at various depths were dominated by silt and sand (average 82.37%), while clay fractions accounted for only 7.90 to 36.63% (average 17.6%) in an increasing order of XNC, SL2, SL1 and DP soil profiles. The highest clay content generally recorded in the sub-soil layers, while the lowest value recorded in the upper surface except for DP soil profile.
3.2 Isotopic composition
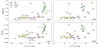
The δ13C and δ15N isotopic compositions of the four studied soil profiles from Yunnan Plateau, Southwestern China are presented in Figure 3. The overall δ13C and δ15N values ranged from -15.64‰ to -25.82‰ and from 2.77‰ to 14.36‰ respectively and vary with soil depth. The general trend indicates that δ13C values increased with depth for the initial 0-20 cm for the soil profiles except for DP soil profile and the lower section of the profiles which indicate a decrease in δ13C values with depth. On the other hand, the δ15N values varied rapidly with depth with no obvious trend (Figure 3).
4. Discussion
4.1 Factors affecting TOC and TN vertical distribution during SOM decomposition
Land use significantly influenced the levels of the TOC and TN contents in soils, more so in the first 0-100 cm layer [31] as well as soil bulk density [32]. Several studies reported that TOC and TN contents were much higher in cropland than in native forests [33-35], while other studies reported that forest soils tend to have higher TOC and TN contents than other land use such as cropland, grassland and shrub land [36,9,31]. Our studied soil profiles are located on mountainous landform over karst rocky desertification area with relatively low TOC content in upper soil surface and at greater depth (<2.25%). The low TOC content maybe due to limited vegetation cover as indicated by field assessment coupled with the area’s susceptibility to erosion and human disturbance [37].
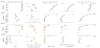
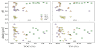
Soil pH, soil bulk density and clay content seem to have slight influence on TOC and TN concentration in this karst soil as they indicate weak correlations among the soil profiles (Figure 4 and 5). This may be due to the various degrees of human disturbance and the heterogeneity nature of karst soils. Other studies, for example Njeru et al. [38] have reported negative correlation among soil density, TOC and TN contents. The suppression of possible mineralization and nitrification process in soils may be the reason for the correlation with soil bulk density [39]. Furthermore, soil with low bulk density has the ability to store greater amount of TOC and TN content, as they can be mobilized through porous spaces within the soil profiles.
In this study, carbon loss is facilitated by the monsoonal climatic condition as the seasonal precipitation (average 800-850 mm) impacted on the vertical translocation of dissolved organic carbon (DOC) and anaerobic oxidation especially during the dry period as indicated by the sharp change in δ13C values for all sites except for DP profile (Figure 2). The observed pattern of δ13C for the soil profiles can be explained by the decomposition of TOC which directly affects isotopic composition by kinetic fractionation with preferential substrate decomposition [40]. For all the studied soil profiles except for DP, the 13C which is the heavier isotopes became enriched with increasing depth to approximately 20 cm. This clearly indicates kinetic fractionation whereby soil microorganisms during SOM decomposition preferentially removed the lighter 12C isotopes leaving behind substrate that is isotopically heavy or enriched [41,42,15]. On the other hand, at greater depth below 20 cm, the decrease in δ13C values was due to the translocation of DOC from surface to deeper depth [43]. The subsoil horizons with low carbon contents, may have dissolved organic matter (DOM) readily adsorbed to mineral surfaces, resulting in the reduction of δ13C in soil [44,43]. Furthermore, the mixing effect of organic carbon derived from bedrock and modern plant may leads to decrease in δ13C value at deeper depths [45]. Monsoonal climatic conditions influence both decomposition and translocation processes which explain the carbon gain in the upper surface and carbon loss in subsoil. Zhu and Liu [46] found similar result where δ13C values declined with depth in karst soils.
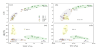
Vegetation is the primary source of TOC and TN which can significantly affect the quantity and quality of soil organic matter [47]. The low TOC content (0.28%) in the upper layer of SL1 soil profile may be due to its limited vegetation cover coupled with the susceptibility to erosion due to its geomorphic position. The SL1 soil profile is the uppermost profile with an elevation of 1770 m surrounded by few shrubs and herbaceous plant species (Figure 1). Xiong et al. [37] pointed out that this studied karst area is severely affected by physical erosion and chemical weathering. Conversely, the upper surface layer of SL2 soil profile has a much higher TOC content (2.11%) than the other soil profiles (Figure 2). This is primarily due to its location being below SL1 soil profile at an elevation of 1730 m and so benefited from erosion and deposition of SOM from higher landform (Figure 1). The other profiles upper soil surface TOC content relatively higher (0.9%) and reflect the input of freshly decomposed matter from surrounding vegetation. The exponential decrease in TOC content is consistent with some other studies [36,48,9,49,46] and is closely linked to the evolution of the soil profile [41] as well as the amount of activity from soil microbes [46]. Both the TOC and TN concentrations are influenced by the erosion of carbon rich soil from upper surface layer [50,51] and by the subsequent degree of decomposition, depositional processes, delivery routes and amount of preservation. Our results indicated that the soil profiles TN contents were positively correlated with the TOC contents (r2 =0.98, 0.99) for SL1 and SL2, however weak correlation for XNC and DP profiles respectively (Figure 6). The result implied that the carbon and nitrogen were of similar organic origin for SL1 and SL2 profiles and that soil water affected N in XNC and DP profiles. The predominant source of nitrogen is from animal residue in SL1 profile, while leaf-litter, biological nitrogen fixation, and organic matter dominate the other profiles [52]. This strong positive correlation between TOC and TN contents were found in other studies e.g., [53,54,9,55,37].
The C/N ratio in soil and litter may be an indicator of the rate of decomposition [46]. For example, the lower the C/N value the higher the decomposition rate [56]. In comparison to other studies for example, Liu et al. [9] found C/N values range from 8.22 to 10.52, while our study C/N ratio were >10 for all the upper surface soils, except for SL1 profile (Figure 2). These findings indicate that the upper soil surface for the studied soil profiles, have a low rate of decomposition and low accumulation. The C/N ratio reflects carbon input, therefore the relatively high C/N values in the upper surface indicate the high C content in the surrounding shrubs and herbs vegetation. Furthermore, the results also indicate that SL1 average C/N values fall in the range of cropland (disturbed) i.e., >10 (Table 3 supplementary), while the other soil profiles average C/N values reflect typical undisturbed native land (<10) according to Zhang et al. [35]. The soil C/N ratio showed strong positive correlation with TOC (r2 = 0.772, 0.822, 0.929 and 0.931) and TN contents (r2 = 0.694, 0.782) for SL1 and SL2, however weak correlation for XNC and DP soil profiles respectively (Figure 5a & b). This was directly due to influence of vegetation cover and water availability in the soil. The C/N ratio generally decreases with increasing age of SOM in soils [57] and reflects the degree of SOM decomposition [58,59]. The C/N ratios of SOM in the studied soil profiles decrease with depth except for the upper soil surface layer for SL1 (Figure 2) which recorded low C/N ratio value due to low vegetation cover and high erosion. The extremely low TOC, TN and C/N ratio coupled with the decreasing trend with soil depth experienced by this karst rocky desertification area were influence by land use, monsoonal climate, topography and vegetation cover.
4.2 Source of soil organic matter (SOM)
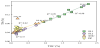
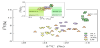
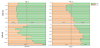
Soil is a direct sink for organic carbon and nitrogen with their stable isotopic signatures registered at any depth reflecting the dominant vegetation type. Many researchers used δ13C and δ15N isotopes along with C/N ratio to better identify the origins of soil organic matter [21]. In using δ13C values, higher terrestrial C3 and C4 plant matter are considered to between -23‰ to -30‰ and -9‰ to -17‰ respectively [17], while that of soil organic matter ranges between -22‰ to -25‰ [60]. Most non-fixing nitrogen plants have δ15N values in the range of about +5‰ to ±2‰, although plants with δ15N values less than -10‰ or greater than +10‰ are not unusual [61]. Our results indicated vertical variation of δ13C for the studied soil profiles (Figure 3). The δ13C values for soil profiles ranges between -15.64‰ to -25.82‰ with an average of -20.03‰ to ±3.02.Our results indicate that some values fall in the range of C3 plants based on Boutton [17] (-23 to -30‰) and outside the C4 plants range (-9‰ to -17‰). Soil profiles for example XNC and DP have larger δ13C values range which fall in the C3 plant and soil organic matter range according to Goni et al. [60] and Thorp et al. [62] (Figure 7). The variation in isotopic signature was as a result of the mixing of both C3 and C4 plants as well as soil microbes which can hinder the contribution of C3 or C4 plants, and hence affect the accurate interpretation of SOM sources. However, for this study, the results of mixing model based on Landi et al. [63] implied that the TOC in soil profiles C3 and C4 proportion contribution vary with depth (Figure 8). The average C3 plants percentage contribution was approximately 24%, 49%; 48% and 73% for SL1, SL2, XNC and DP profiles respectively (Figure 8). In the case of SL1 profile, the soil organic matter is strongly influenced by other sources (e.g., animal residues) as evident by droppings in the area; hence the relative enrichment in δ13C values (Figure 7). Furthermore, SL1 profile surrounding vegetation consists of shrubs and herbaceous plant species which contributed to the higher proportion of C4 plants. The low value of δ13C in the upper surface of soil profiles implies that soil organic carbon mainly derived from decomposition of fresh plant matter, especially since surface horizons of soils reflect the C3 to C4 ratios of the present vegetation [64]. The δ13C values for soil profiles SL2, XNC and DP are closer to the C3 plant range, as reflected in the higher proportion of C3 plants, while SL1 profile is obviously different and closer to C4 plants range (Figure 7). The immediate surrounding vegetation of SL2, XNC and DP profiles comprised of shrubs, thatched grass, and coniferous trees species that account for the high variation in isotopic signatures. The DP soil profile, however, recorded the most depleted (-21.18‰) δ13C value in the upper soil surface than the other profiles (Figure 3). This is because DP profile which is located at the highest elevation would have the least contribution of soil deposition and accumulation from other land forms and so reflect δ13C values close to the above vegetation. In addition, at greater soil depth the slate bedrock influences the mixing effect of organic carbon thereby causing variation in δ13C values.
The δ15N values for plants are affected by the δ15N values of soil, resulting in a close relationship between soil and plant nitrogen composition in the ecosystem [65]. In addition, the influence of atmospheric deposition can also affect δ15N values in soils, for instance Southwest China wet deposition for is 2‰ and for is -12‰ [66]. The input of plant organic matter and atmospheric deposition cannot explain the high δ15N values in SL1 profile. The presence of animal residue however could account for the relatively high δ15N value registered in SL1 soil profile. The other soil profiles SL2, XNC and DP, δ15N values fall within the range of C3 and C4 plants, except for one point in XNC soil profile (XNC-3 registered δ15N= 13.22). The high δ15N value in XNC profile maybe due to soil water migration and transformation of nitrogen as a result of microbial activities. Stewart et al. [67] reported that soil water processes affected reduction and oxidation environment, which control nitrification and denitrification. The δ15N values in the studied soil profiles which fluctuate with depth indicate microbial activities during mineralization, nitrification and denitrification. The enrichment of δ15N that occurred in the upper soil surface 0-20 cm of all the studied soil profiles was due to decomposition of SOM by microbes and root uptake of 15N- depleted [68,69]. The high variability of δ15N in the subsoil was attributed to soil water processes and reduction / oxidation environment involving nitrification and denitrification [67]. The seasonal wet and dry conditions in this karst environment due to monsoonal climate facilitate intensive microbial activities in the upper surface as well as translocation of dissolve organic nitrogen at depth resulting in high variability in δ15N.
In addition to δ13C and δ15N isotopic signatures, C/N ratio can also be used to support the suggestion that the studied soil profiles comprised of mixed organic matter sources. Studies have shown that the C/N ratio of higher terrestrial plants are usually >15 [61,70] and that C/N ratio of soil organic matter is usually between 10 and 13 [71,72]. The C/N ratio of SL1 soil profile is between 10.3 and 13.4, with an average of 11.75±2.3 (n=10) (Table 3 supplementary), which suggest that the sources of organic matter are uniform and not mixed i.e., in-situ (endogenous) to the soil profile. However, the others oil profiles showed high variation in C/N ratio in the upper soil surfaces which are obviously different (>10) from the lower layers (Figure 2). This indicates that the sources of organic matter are mixed; reflecting the influence of both exogenous and endogenous sources. A weak positive correlation was observed between the δ13C and C/N ratio for the studied soil profiles, suggesting that both parameters are influenced by the same factors such as source of organic matter and decomposition rate of SOM. It is evident that the source of organic matter within this karst area of Yunnan plateau, Southwestern China has mixed contribution of C3 and C4 plants with animal residue influencing SL1 profile in particular.
4.3 Behaviour of δ13C and δ15N isotopes in karst soil profiles
In ecological studies, differences in abundance of δ13C and δ15N isotopes are important in the evaluation of changes under varying conditions of SOM decomposition and land use. Overall, our results indicate that δ13C and δ15N values varied with soil depth with δ15N values showing greater irregular fluctuation (Figure 3). Meanwhile, the general trend observed for δ13C values was enrichment in the upper soil surface layer to approximately 20 cm, followed by depletion with increasing depth. However, DP profile was an exception which indicated a decrease in δ13C values with depth (Figure 3). The increase in δ13C values of SOM with soil depth by 1-3‰ is a characteristic feature of forest soils [41,73] which indicate microbial activities during SOM decomposition. Soils dominated by aerobic decomposition have a clear increase of δ13C values with depth. This is due to preferential release of the lighter 12C isotopes during aerobic mineralization. The initial 0-20 cm soil layer in our study indicates a 1-4‰ increase which supported the general trend for forest soils. Several studies have shown that both isotopes of C and N become more enriched in the heavier isotopes with increasing soil depth [41,12,74,75,59,73,76]. In our study the observed small enrichment trend of δ13C in surface soils were related to kinetic fractionation caused by microbes rather than Suess effect or change in plant community composition as these would reflect much larger variation. In contrast soils that experience suppressed degradation due to anoxic conditions, coupled with DOC translocation usually indicate a decrease in δ13C values with depth. The decrease in δ13C values is due to enrichment of recalcitrant organic substances during anaerobic mineralization, which result in depletion of the heavier 13C. Furthermore, subsoil horizons with low carbon contents may have DOM readily adsorbed to mineral surfaces, resulting in the reduction of δ13C values in soil [44,43].
Soil δ15N values related to the nutrient input, humification and nitrogen transformation as influenced by land use and land cover change [77]. The difference in δ15N values observed were mainly due to influence of animal residues, in the case of SL1 profile as well as the differences in forest vegetation foliar N content, which depend on species, precipitation and temperature [78]. The general trend naturally for δ15N in forest soils was the presence of two pools; top surface soil with low δ15N values and subsoil with high δ15N values [79]. The vertical distribution of δ15N in this karst area showed high fluctuation which peak at depth for all the studied soil profiles (Figure 3), except for XNC soil profile which peak at 25 cm (Figure 3). This was due to the spatial dynamics of soil water processes and the influenced of reduction / oxidation reaction associated with SOM nitrification and denitrification [67]. Water availability affects the cycling of carbon and nutrients and thereby regulating the growth and distribution of microbes. Similarly, strong fluctuation in δ15N with depth were reported by Liu et al. [9] in karst watershed. The high variability pattern of δ15N distribution in these soil profiles is associated with fractionations that occur during the process of mineralization, nitrification and physical mixing. The peak of δ15N in the deeper soil profile is common with other findings [80,58,81]. This is because, at depth, microbial excretions of ammonium and nitrate become less depleted in δ15N, while the humus content of nitrogen becomes enriched, and the uptake of nitrogen by plant roots lower the δ15N abundance in the microbial reserve; hence the total soil becomes enriched [58]. In addition, further δ15N enrichment with depth may be because of N loss during high precipitation input. The high complexity of soils containing several isotopically different forms of nitrogen [82,72] resulting in N irregular behavior with the notable high variation in δ15N values with depth for the studied soil profiles. The δ15N isotopic composition in soils and groundwater may not only be influenced by its source but also by microbial activities and physical processes such as ion exchange [83].
Our results illustrate a non–conservative behaviour in δ15N that is largely due to a combination of microbial activities and water availability, which affects redox reactions (Figure 3). The monsoonal climatic condition along with the topographical features of karst environment provide the uneven distribution of soil which result in the spatial and temporal disparity in soil water [84]. Essentially, the loss of nitrate through denitrification result in enrichment of δ15N content in the remaining substrate, while during nitrification process, the lighter 15N isotope is preferentially incorporated into nitrate resulting in a decrease in δ15N [83]. Therefore, the dominant mechanism affecting δ15N within karst area of Yunnan Plateau, Southwestern China are mineralization in the upper surface, and multiple transformation processes such as translocation, nitrification and denitrification in the subsoil.
The positive and negative correlations of both δ13C and δ15N of soil TOC and TN (Figure 9) respectively, reflect isotopic fractionation associated with litter fall decomposition, microbial activities, translocation and physical mixing processes. Forest soils are characterized by litter fall and root exudates that are constantly being decomposed and gradually mixed within the soil profile [85]. The older more decomposed SOM are found lower in the soil profile as a result of further decomposition, physical mixing, leaching and vertical mobilization [86,79]. On the other hand, the newly decomposed or fresh C and N inputs are found in the upper soil profile [87].
Coupled relationship between δ13C and δ15N was used to identify the transformation and translocation processes of SOM. Han et al. [36] reported that if a positive linear relationship occurred between δ13C and δ15N of SOM in native forest land, then soil N utilization efficiency is sufficient, that is, there is a high consistent enrichment of 13C and 15N with SOM decomposition. Our results however indicate weak negative correlation between δ13C and δ15N for the soil profiles (Figure 7). Therefore, it was interpreted that the coupling effect of C-N isotopic fractionation was not observed for this karst rocky desertification area, suggesting low N utilization efficiency. The limited vegetation cover means less uptake of N by plant root system. In addition, the negative correlation was interpreted as the mixing of isotopically distinctive carbon and nitrogen source [88,89], as well as microbial activities. Based on the δ13C and δ15N regression slope, the studied soil profiles can be placed in order of increasing disturbance and soil stability i.e., DP, XNC, SL2 and SL1 profiles respectively (Figure 7). This provides support that δ13C and δ15N isotopic assessments along with combination of other parameters can be used as a monitoring tool to determine source, transformational processes and disturbance of karst soils.
5. Conclusions
This study provides insights into sources and distribution of soil organic matter, as well as the behaviour of carbon and nitrogen isotopes within karst soils in Yunnan Plateau, Southwestern China. The joint end-member analysis of δ13C, δ15N and C/N ratios revealed that soil organic matter comprised of mixed sources derived from exogenous and endogenous materials. The small variation in δ13C values indicates that no historic change in vegetation had occurred for the soil profiles. Furthermore, the proportional contribution of C3 and C4 plants vary with soil depth, with C4 plants dominating one particular profile which was supported by field vegetation assessment. Anthropogenic activities, monsoon climate, topography, and vegetation cover were linked to the variation in TOC, TN, δ13C and δ15N contents which impacted on soil stability of this upland karst rocky desertification area.
The stable carbon and nitrogen isotopes revealed vertical variation and spatial differentiation, which reflected activities of SOM mineralization, translocation and mixing. The increase in δ13C values was influenced by mineralization and selective preservation in the upper surface while the decrease was controlled by translocation and carbon mixing in the subsoil. Conversely, the high vertical variation in δ15N were controlled by differences in the plant composition and fractionations that occurred during the process of mineralization in the upper surface, while multiple transformation processes occurred at depth.
The coupled negative correlation between δ13C and δ15N indicate the enrichment and depletion of 13C and 15N with SOM decomposition which suggest low N utilization efficiency for this karst rocky desertification area. In addition, to the mixing of isotopically distinctive carbon and nitrogen source. The findings suggest that within karst environment combination of δ13C and δ15N isotopes along with other parameters can be used as a tracer proxy to determine soil organic matter source, transformational processes and soil disturbance or stabilization.
Competing Interests
The authors declare that they have no competing interests.
Acknowledgments
The authors are indebted to Professor Shijie Wang for suggestions and discussion about this study. This work was jointly supported by the National Natural Science Foundation of China (NSFC) grants (Nos. 41473122, 41073096), National Key Basic Research Program of China (2013CB956702) and the Hundred Talents Program of the Chinese Academy of Sciences.
Data Availability
All the data sets for this research are available in Table 1-3 of the manuscript. The data supporting Figure 2-9 in the text is available in Table 1-3.
Note: Graphy Publications remains neutral with regard to jurisdictional claims in published maps and institutional affiliations.