


1. Introduction
Flooding is one of the most periodic and distressing natural phenomena which occurs as a result of climatological factors, often influenced by anthropogenic intrusion such as increasing human settlements within low-lying areas and buildings close to flowing rivers [1]. The rising frequency, magnitude and level of intensity of flood events across the world has led to individual awareness of the essentials of flood preparedness and mitigation measures [2]. A flood simply means a state of high water level along a river channel or on a coast that leads to inundation of land which is not normally submerged [3].
Flooding in Nigeria is usually coastal, flash, fluvial or pluvial [4]. The river environment mostly experiences coastal and fluvial flooding which is mostly caused as a result of seasonal water surge from large rivers and increasing sea level rise. Nigeria has experienced several flood events of which the October 2012 deluge is remembered as the most extensive and destructive. Also, most thriving central business districts including those in Lagos, Nigeria are located in flood plains, valleys or on coasts which serve as additional location advantage that favors development. The World Meteorological Organization & Global Water Partnership - WMO/GWP [5] report stated that access to adequate water supply for economic activities, domestic use, recreation, beautiful views and other factors are the determinants that influence the populace residing in close proximity to oceans and river banks, coastal areas, shores and lagoon areas like the case of Lagos.
Urban flooding is becoming an issue that may reform the outlook of whole cities as most of them are usually inundated during torrents that tend to accumulate on impermeable surfaces. This is due to increasing urbanization coupled with the lack of planning strategies in cities, the deterioration and blockage of the drainage infrastructure and increasing construction of buildings on floodplains [6,7]. In Lagos, it was reported that eight different flood events led to the death of a minimum of 30 individuals between the year 2011 and 2012 [8]. Dartmouth Flood Observatory (DFO) submitted that from local reports, close to 6 individuals lost their lives to the flood that occurred in Lagos on the 21st of October 2019. The flood waters emerged due to the overflow of Oyan Dam in Abeokuta city of the southwestern Ogun state. Aside from the loss of life, houses were damaged and numerous business hubs and education institutions were locked down.
Flooding in major urban areas is predicted to intensify due to climate change, rapid population increase and urban sprawl. In other to mitigate the risk emerging from flooding and for effective flood risk management, there is a need to have deepened understanding of where flooding would occur and at what level of risk. Aderogba [9] recommends that effective flood risk management is highly essential to mitigate the impact of flooding in Lagos state, Nigeria. It is evident in preceding studies that flooding in Lagos is becoming so overwhelming, distressing thousands of people and causing large socio-economic damages [10-12]. It is more predominant in areas defined as possible flood-risk zones by the Hydrological Services Agency, such as; Amuwo Odofin, Lagos Island, Ikeja, Oshodi/Isolo, Eti-Osa, Ojo, Agege, IfakoIjaiye, Badagry, Apapa, Surulere, Kosofe, Alimosho and Ajeromi-Ifelodun Local Government Areas (LGA) [13].
There has been an increasing impacts of flooding events in Lagos state Nigeria. According to Nkwunonwo [14], a severe occurrence of flooding event of July 2011 affected approximately 5000 individuals (both dependent and working-age group) while 25 deaths were recorded due to the flood event. Public infrastructure such as bridges, schools and road networks, as well as residential houses were all inundated and destroyed by floodwater [15,16]. Umar [17] thus concluded in one of his papers that concurrent flooding demands studies that make use of spatial datasets and geospatial technology in predicting areas that are susceptible to future flooding.
In the recent year, there has been increasing use of geospatial information system and earth observation dataset for analyzing flood-risk susceptibility and this is because the approach provides an accurate prediction of flooding, modeling of hydraulic and detecting of inundated areas. The results of the analysis derived from those geospatial datasets help to improve flood early warning and emergency response [18-20].
The use of the multi-criteria approach (MCA) through the Geographic Information Systems (GIS) analyst tool involves the overlaying of contributory natural and human factors by combing dataset of slope, elevation, drainage density, land use, building density and other parameters to access the flood susceptibility level of different locations which can lead to a proven action for flood risk mitigation [21-23]. These parameters which are majorly in geospatial data format are assigned dissimilar weights which are in accordance to their impacts in causing potential flooding [24].
According to extant literature, there seems to be a real call for unceasing monitoring and planning to better fare with flood events in the future and this can be achieved only by adopting a systematic approach to reveal susceptibility to a future flood. There is a dearth of studies on flooding in Amuwo Odofin LGA despite the concurrent flooding event in the area in the past years. The general research method of this study combines several selected datasets which include elevation, slope, proximity to the river, rainfall intensity and land use/ landcover. These spatial datasets were analyzed to reveal the different range of ‘flood susceptibility’ (low-high vulnerability).
This study thus executes a geographic assessment of flood susceptibility which revealed locations at varying risk levels to flooding in Amuwo Odofin. The findings will not only help to improve preparedness and mitigation to flooding but will also support the government and other relevant authorities to make policies that can improve the adaptation and resilience of the populace to the effects of flooding that might occur in the 2021 rainfall onset.
1.1 Study area
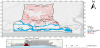
Amuwo Odofin is one of 20 LGAs of Lagos state. It between Latitudes 6° 24' 00"E - 6° 32' 30"E and Longitudes 3° 11' 00"N - 3° 22' 30"N (Figure 1). It is bounded by Ajeromi and Ifelodun Local Government Area (LGA) to the east, Oriade LGA to the west, the Badagry Creek to the south, and Isolo/Igando LGA to the north. The LGA is subdivided into two local councils namely Oriade and Amuwo Local Council Development Area (LCDA). The wards within LGAs include Agboju, Irede, Ilado Tamaro, Abule-Osun, Odofin, Kirikiri, Ijegun, Kuje, Ado-soba, Ekoakete, Ifelodun, Irepodun, and Orire wards. There are 67 communities, which are categorized into urban, semi-urban, and rural. According to the latest population census of 2006, the LGA has a population of over 1,500,000.
2. Methodology and Dataset
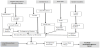
This paper adopts a multi-criteria approach to produce a flood susceptibility map that indicates locations in Amuwo Odofin LGA that are susceptible to flood risk. This method combines various geospatial datasets including rainfall amount, slope, distance to water bodies, elevation and land use land cover. The cartographic model (Figure 2) summarizes the step-by-step approach adopted, data sets, analytical processes and the final result.
2.1 Type of data and sources
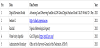
The dataset used for this study includes Digital Elevation Model (DEM), Sentinel 2, water body data, rainfall data, and Amuwo Odofin Administrative boundary. All the data are secondary and were sourced from reliable platforms (Table 1).
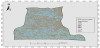
In this paper, the Advancing Land Observing Satellite - ALOS Global Digital Surface Model "ALOS World 3D with a resolution of 30m was acquired for the DEM. The topography of a place orders the flow of floodwater and is key to flood extent estimation [25]. In line with this, Njoku, Efiong, Uzoezie, Okeniyi & Alagbe [26] revealed that places with settlements on a relatively low elevation are more susceptible to flooding. Elevation (Figure 3) and slope (Figure 4) were derived from the elevation data which is a gridded digital illustration of terrain which has each pixel values well-matched to a height above a datum [27].
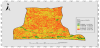
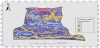
Also, more runoff is associated with areas that have steeper slopes, therefore, making such areas to be susceptible to flooding [28]. Ballerine [29] also asserted that in areas with low slopes, there is going to be a significant reduction in the movement of water and a surge in the likelihood of water logging. Also, the land-use type of a location such as areas of buildings and roads concentration often reduce the percolation size of the soil leading to a larger increase in the water runoff, while land use zones with a concentration of vegetation serves as water storage and is less susceptible to flooding [30]. The land use classification map (Figure 5) was derived from the Sentinel 2A data (January 28, 2021) at a 10m resolution. Color composite of the study area was extracted by combining bands 8, 4 and 3 of the Sentinel 2 data. Using the composite band, training sites were selected in accordance to the spectral signature of each cell. In this study, LULC was classified into three classes which include; built-up, vegetation and waterbody. These class types were mapped because of their roles in shaping the occurrence of flooding.
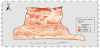
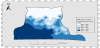
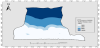
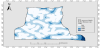
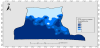
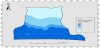
A high amount of rainfall often contributes to the emergence of flooding [31]. Rainfall data were obtained from the NIMET rainfall prediction for the year 2020. The data contains the coordinates of some locations in the study area with their annual rainfall amount (Figure 6). The rainfall values were interpolated using the Inverse Distance Weighting (IDW) technique. The southern region of the area recorded a higher intensity of rainfall (1909 mm). The intensity reduced towards to the north where there were values less than 1884 mm. The water body dataset was sourced from the GeoReference and Infrastructure Data for Development which is the Nigeria geospatial dataset platform. The smaller rivers (Figure 8) were ordered from streams one to three based on Strahler’s [32] classification methods through the use of the digital elevation dataset. The spatial analyst toolwas used to create multiple ring buffer zones from the water body data set. The big rivers and lagoons that run through the study area were buffered at 1000m (Figure 7) while the smaller rivers were buffered at 500 m (Figure 8). This was adapted from the study of Njoku, Efiong & Ayara [24], where the buffer of the smaller river was assigned a buffer distance of 500m. Similarly, Amangabara [33] buffered and queried spatial data of communities at risk within 500m, 1000 m and 1500 m distance to the river. Likewise, Olokeogun [34] used a buffer of 150 m and 500 m to analyze the flood inundation at the riparian habitat boundaries using lake boundary as input data. For this paper, the elevation, slope, rainfall, LULC data were already in raster format while only the waterbody layer was converted from vector to raster format.
2.2 Parameter reclass and rating index
The datasets used for the study were reclassified by adopting the natural breaks (Jenks) grading method. The elevation data and the slope were reclassified into 5 (Figure 9 and 10). This is similar to the works of Adjei-Darko [35] and Oriola [36] who reclassified elevation, slope and rainfall into 5 classes. LULC was also reclassed into 3 since the LULC of the area were aggregated into only built-up areas, vegetation and water body as shown in (Figure 11). Also, rainfall intensity was reclassified into 5 (Figure 12). The buffers of the water bodies were converted to raster using the polygon to raster tool and then reclassified into 5 (Figure 13). Furthermore, respective rating indexes were assigned to the reclass of each parameter (Table 2).
User-defined rating by considering the importance of each criterion on a scale of 1 to 5 was assigned to the elevation, slope, rainfall and proximity to the waterbodies. Locations with elevations less than 12 m were rated as high-risk zones. The areas within this zone were weighed1 as they are areas that are more susceptible to being impacted by flooding. Elevations more than 12 m were assigned low-risk rating with a reclassed value of 4 to 5 representing low susceptibility to flooding. Also, slope was reclassed into 5 (Figure 10) which are in an array of areas with low slope percentage to the highest. A reclassified value of 1 to 5 was assigned with 1 being the most susceptible, while 5 is low susceptibility (Table 2). The reclassified slope in this study is in line with Njoku, Efiong, Uzoezie, Okeniyi & Alagbe [26] who also reclassified slope into 5 classes. Land use land cover was reclassified into 3 (Figure 11). The value 3 represents the vegetation zone, which is least susceptible, value 2 represents built-up while 1 represents waterbody which increases susceptibility to flooding (Table 2).
Furthermore, rainfall data was reclassified into 5 (Figure 12). Higher rainfall intensity was assigned a class value of 1 which means the areas likely to be flooded while areas with mild rainfall intensity were assigned a rating value of 5. Big river buffer (Figure 13) was reclassified into 5. The value of 1 was assigned for areas within 1000 m radius while areas above the 1000 m range were assigned a rating value of 5. The small river buffer (Figure 14) was reclassed into 4; a reclass value of 1 for areas within 500m buffer and the value 4 to the extensive buffer farther from the river (as shown in Table 2). This decision was in line with the work of Uddin [37] who ranked ‘1’ to mean zones with the most flood potential and ‘5’, least flood potential zones. Furthermore, Saini [38] ranked 1 to represent the most important factor and 6 the least significant.

The buffered rivers (big and small) were converted from their initial vector formats to raster in a bid to enable weighting since the weighted overlay analysis uses raster files. This was done on ArcGIS Pro using polygon to raster tool.
2.3 Procedure for weighting
According to the Environmental System Research Institute [39], the weighted overlay tool allows the implementation of several steps in the general overlay analysis process within a single tool. It is a widely used method for solving multicriteria problems such as site selection and suitability models. Each criterion weighting determines its impact on the final flood susceptibility result. The weight apportioned for each criterion is often on grounds of expert knowledge on the importance of each parameter and sometimes based on analytical procedures and literature. Njoku, Efiong, Uzoezie, Okeniyi & Alagbe [26] assigned the highest weight to proximity to the river followed by elevation and slope. Ouma &Tateishi [40] also weighed the impact of slope second to soil type. Furthermore, Affi [41] considered the distance to the river as the most important factor for flood risk mapping.
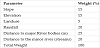
Hence, this study placed more importance on the four most relevant criteria; proximity to rivers, elevation, slope and rainfall while also incorporating LULC as the fifth parameter. Following this pattern with a predisposition to the choices of preceding authors, distance to the river was assigned a weight of 25% for big rivers and 20% for small rivers, simply because the overflow of the major and minor river banks contributes greatly to flooding. Topography which comprises of elevation and slope were assigned 15% respectively, taking inference from the elevation and slope map of Amuwo Odofin that shows that a greater portion of the region is within a low terrain. A weight of 5% was assigned to LULC and 20% to rainfall. The summation of the weighting is equal to 100% which enables the possibility of conducting the weighted overlay analysis (Table 3). The weighted overlay tool combines several raster layers based on the weights of each raster according to its assigned importance using a common measurement scale.
3. Results and Discussion
3.1 Flood risk-susceptibility zones in Amuwo Odofin local government area
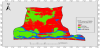
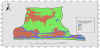
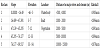
The weighted overlay analysis tool on ArcGIS Pro was used to rate and weigh all the important parameters (Table 3) that led to the generation of a flood risk-susceptibility map of Amuwo Odofin LGA (Figure 15). The flood risk map was classified into four susceptibility zones ranging from very high, high, low, to very low-risk zones. The high and very high-risk zones are areas where flooding can emanate easily as a result of an increasing amount of rainfall and overflow of the river channel. The very low and low-risk zones are locations where the probability of experiencing flood is relatively low, although with chances of flooding triggered from man-made activities such as blocking of drainage channels.
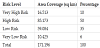
The southern part of the LGA indicates more susceptibility to flooding due to the proximity to the Owo River and its streams, land use and low elevation of this region. Because of the resident’s means of livelihood, field observation revealed that a significant number of people reside and carry out trade at close proximity to the river which is unsafe and highly prone to flooding. The findings as shown in Table 4 reveals that Amuwo Odofin covers about 171.19sq km out of which 10 % (16.5sq km) is in the very high-risk zone and 50 % (85.1sq km) in the high-risk area. The communities within the very high-risk and high-risk zones in Amuwo Odofin, which would very likely experience flooding in 2021 and at later years include:Iyagbe, Ibese, Isunba, Irene, Kirikiri, Aiyetoto- Asogun, Elachi, Isuba, Olute, Satellite town, Alapako, Amuwo and Agboju. Also, communities at low-risk zones include Ijegun, Iseri- Osun and Ijagemo. Significantly, some roads and other social infrastructures within these communities are set to be overrun by the deluge, while buildings will as well be submerged.
The study shows that floods occur mostly in the areas of low elevation and that are at close proximity to water bodies. Due to the low elevation at the southern parts of the LGA, surface run-off from the northern axis accumulates in the former, thereby exacerbating the occurrence of flooding. Additionally, an increase in rainfall amount that can be attributed to the effect of climate change also plays a key role in contributing to the occurrence of flooding in the study area.
The findings in this paper agree with that of Ogbonna et al. [42] and Shettima et al. [43] whose studies proved the impact of topography as a dominant factor contributing to the occurrence of flooding. It also corroborates with the findings of Koem et al. [44], which identifies the nearness to major rivers and streams as a determinant to the vulnerability of people to future floods. Therefore, it is very important that low lying areas close to water bodies at Amuwo Odofin and elsewhere be given maximum mitigation and adaptation considerations such as evacuation planning or improvement of their adaptation strategies to cope with flood occurrence.
4. Conclusion and Recommendations
The paper adopted the use of GIS through the use of the MCA in analyzing flood susceptibility. MCA makes use of several datasets using the GIS platform to present outputs in an all-inclusive way that can be used to draw inferences. This criterion and dataset selected to assess the susceptibility level of flood risk at Amuwo Odofin LGA were major determinant factors that often led to flood occurrences.
The flood risk-susceptibility map indicates the spatial variation in the level of risk at different settlements within the study area. This findings from this study are relevant to support the implementation of flood mitigation policies and action plans towards risk reduction measures for the populace of Amuwo Odofin LGA, especially for residents living in the high and very high flood-risk zones. Considering the rising impacts and consequences of flooding at several LGAs of Lagos State in the past year, the need for a well-analyzed flood-risk susceptibility map is timely as the new rainfall onset approaches.
The findings from this study will also guide town planners, civil society organizations, emergency management agencies and other important stakeholders to implement preparedness, evacuation planning and early warning communication to settlements within the inferred flood risk zones. Furthermore, the construction of drainage channels are capable of checking the floodwaters in areas that are of high and very high risk to flooding. The government should as well enforce laws that guide against residential, commercial or any other form of development within deduced flood risk zones. As a last resort, relocation and evacuation can be timely, guided by the flood risk map, for the residents in danger zones.
Competing Interests
The authors declare that they have no competing interests.
Data Availability
The datasets generated and analyzed during the current study are available from the corresponding author on reasonable request.