


1. Introduction
In 2018, the global palm oil production and consumption were 70.6 million tons and 66.4 million tons, respectively. Palm oil accounted for 35.7 and 38.6% of global vegetable oil production and consumption, respectively. The main producers of palm oil are the members of the Association of Southeast Asian Nations (ASEAN). Indonesia produces 39.5 million tons of palm oil each year, and Malaysia produces 19.7 million tons of palm oil each year. The two countries together account for 83.8% of the global output [5,15].
Thailand is the third largest palm oil producer, accounting for 3.9% of the global palm oil production. Approximately 84.6% of Thailand oil palm plantations and their processing facilities are in southern Thailand [5]. The provinces of Krabi, Surat Thani, and Chumphon own 60% of the country’s oil palm plantations. The remaining 13.6% are in central, northern, and northeastern Thailand. With the continuous expansion of the palm oil industry in Thailand, primary forests are often logged to establish oil palm plantations. Studies have shown that Thailand’s new plantations come from abandoned farmlands. Imperfect laws and mismanagement have decreased Thailand's forest area by approximately 2,880 hectares since 2016. The rapid development of the palm oil industry has negative effects on sustainability, especially the impact of land use changes and greenhouse gas (GHG) emissions on the environment.
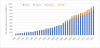
Owing to edible oil consumption and biodiesel production, Thailand's palm oil industry is expanding further. In 2018, the total area planted to oil palm in Thailand reached 922,000 hectares, and it has grown by about 4.5% over the past 10 years (2009-2018). In the same period, the output of fresh fruit bunches (FFBs) reached 15.39 million tons (an increase of 9.1%). Thailand’s palm oil production chain is complete, including oil palm plantations, crude palm oil extraction, edible oil refining, and biodiesel production. The yield of FFBs per hectare by the wet process averages 18.24 metric tons and the water content is about 35.3% [6-15].
The production of crude palm oil (CPO) is mainly divided into the wet and dry extraction processes. Owing to the high production capacity of wet extraction, our survey showed that many factories in Thailand put empty fruit bunches (EFBs) into the boiler to generate electricity during the production process and achieve a certain degree of energy self-sufficiency through recycling. Therefore, the wet extraction process is generally used to convert FFBs into CPO. However, the wet extraction process generates large amounts of solid waste, wastewater, and GHGs. To promote the sustainable production of CPO, good system management is required to reduce the impact of solid waste, wastewater, and GHG emissions on the environment. International organizations, such as the Intergovernmental Panel on Climate Change (IPCC) and the United Nations Framework Convention on Climate Change (UNFCCC) [23], which contribute to decreasing national GHG emissions [21], and clean development mechanism projects, developed a method that takes into account GHG emissions [16].
With increasing attention to climate change, the demand for information on GHG emissions from palm oil products has increased, and the increasing demand for palm oil and pressure from land use changes have led to increased GHG emissions. Group R [25] reported that the Roundtable on Sustainable Palm Oil (RSPO) reformulated its principles and standards, arguing that palm oil production is only sustainable when the mitigation of GHG emissions is considered. The International Sustainability and Carbon Certification provides methods for calculating greenhouse gas emissions and greenhouse gas audits along the biomass and bioenergy supply chain [22,26].
The ISCC method focuses on several raw materials used as biofuels, including corn, rapeseed, soybeans, sugar beets, sugar cranes, rye, sunflower, and wheat. Default or individually determined values can be used in calculations. The emission factors used to convert inputs into greenhouse gas emissions for waste and wastewater treatment are provided from reliable sources such as Bio Grace [17], Stichnothe and Schuchardt [20]. Bio Grace [22] developed the Bio Grace greenhouse gas calculation tool for biofuel production pathways. The Bio Grace method focuses on the production of several biofuels proposed in the ISCC method [28]. The method provides the EF by converting input into greenhouse gas emissions.
Roihatai k believe that a significant emission proportion can be measured by including only two most prominent GHGs, carbon dioxide (CO2) and methane (CH4), for a straightforward, costeffective, and practical assessment useful for all types of organization. All countries agree on using carbon dioxide equivalent (CO2 eq) as a single metric that includes all GHGs. Fenner et al. pointed out that there are three alternative methods for assessing the carbon footprint account of carbon dioxide itself. All their relevant sources, sinks, and storages within the boundaries of the calculated population, system, or human activities are considered [16,20].
The palm oil industry has an important position in Thailand’s national economy. By comparing the EF with Earth’s carrying capacity, one can assess the pressure on resource utilization. Thailand’s annual FFB output in 2018 was 15.39 million tons. However, the oil palm plantation area in southern Thailand is relatively large, and the unit output is relatively high.
EF represents the total demand for land and water ecosystems required to provide resources and global hectares of absorbers of emissions. Carrying capacity is defined as "the average maximum number of individuals of a particular species that occupy a particular habitat without permanently impairing the production capacity of that habitat". In addition, the term biological capability (BC) was introduced as “the capability of the ecosystem to regenerate people from lands. Life, including human life, competes for space. The BC of a specific land represents the land’s capability to provide people’s needs.” The concepts of EF and BC have been used to determine national footprint accounts for all countries [4].
EF analysis has been applied to various of products, processes, organizations, and urban production. In 2016, the per capita EF in Thailand was 2.5 gha, whereas the per capita BC was 1.2 gha. Its biocapacity deficit was 1.3 gha. The lack of biocapacity mainly comes from the carbon footprint component in the ecological footprint assessment. This result shows that Thailand must use resources elsewhere to maintain the lifestyle of the country’s current population. In addition, Thailand needs to improve process efficiency to balance EF and BC [1,3].
The expansion of oil palm plantations in Thailand will lead to a further increase in the country's EF in farmlands, forests, and energy. This expansion in regions where EF is already higher than BC may increase the pressure on the use of resources in that region. To strengthen sustainable oil palm planting, it is necessary to determine the zoning of oil palm plantations by using ecosystems that represent the needs of land and water ecosystems to provide resources and absorbers of emissions.
The benefits of planting crops are an important indicator for considering whether to expand crop planting. In addition, the ratio of benefits to EF can be used as an indicator of global scale benefits and environmental impact.
In this paper, we characterize the current Thai palm oil industry by formulating the research system boundary on the basis of oil palm planting and palm oil production using the GWAPP method to calculate greenhouse gas emissions. Then we discuss oil palm planting and palm oil production, and the main greenhouse gas emission process. The greenhouse gas emissions were quantified for every ton of FFBs harvested, every ton of CPO processed and produced in the Thai palm oil industry. Combined with the carbon footprint analysis model of oil palm planting, the economic benefits in terms of net oil palm income were determined. When calculating the ratio of revenue to EF, the EF of oil palm plantations was used. The purpose of this study is to determine the EF of palm plantations, evaluate the EF of FFBs of oil palm plantations, and determine the ratio of oil palm plantation revenue to EF [3,17].
In this study, we combined the assessment of greenhouse gas emissions the Thai palm oil industry with the ecological footprint analysis. In this paper, we discuss the reduction of greenhouse gas emissions while reasonably reducing the production cost of palm oil. We also provide suggestions for the sustainable development of the Thai palm oil industry.
2. Oil Palm Planting and Palm Oil Production in Thailand
2.1 Analysis of geographical and climatic factors
Thailand is located between latitudes 5°37' N to 20°27' N and longitudes 97°22' E to 105°37' E, with a total area of 513,115 km2. Thailand has a tropical monsoon climate. There are three seasons a year, namely, the hot season from mid-February to mid-May, the rainy season from late May to mid-October, and the cool season from November to mid-February. The annual temperature is no lower than 18°C, the temperature difference is between 19 and 38°C, the average temperature is about 28°C, and the average annual precipitation is about 1,000 mm. The precipitation is relatively abundant, but it is affected by the topography and monsoon [1].
From the topographical viewpoint, the northern part is a mountainous area, an extension of the Himalayas, dominated by the Thanon Thong Chai range. The northeast is the Korat Plateau. The annual precipitation in most areas is only about 1,000 mm. The summer is very dry, and in the rainy season, the soil is very muddy, so it is not suitable for farming. The hills and plains in the central region are complex [16]. The soil in the central area is mixed with a small amount of sandy clay, which has good water retention. It is also the main rice-producing area, with an average annual rainfall of about 1,214 mm. The south faces the sea from east to west, the west to the Andaman Sea, and the east to the Gulf of Thailand. The southern region has a maritime climate, warm and humid throughout the year, with an average annual rainfall of about 2,220 mm. With abundant rainfall and high soil fertility, it is suitable for the growth and planting of oil palm.
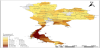
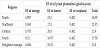
Because oil palms have certain requirements in climate and soil fertility, the current palm production is divided into four regions in Thailand, according to geographical environmental factors and planting and processing conditions: the north, northeast, central, and southern regions. The northern region is mainly composed of hills and mountains. The soil fertility is low, the transportation system is not developed, and the oil palm yield is low. The northeast region is a high-altitude plain, and the central region is a low-elevation plain and river valley area. The southern region is a long and narrow peninsula located in the Andaman Sea and the South China Sea with abundant rainfall, low unit input of fertilizer, and a relatively convenient transportation system. Figure 1 shows the oil palm plantation areas and harvested areas in Thailand in 2018. The Thai oil palm plantations are mainly distributed in the central and southern regions and their areas are increasing yearly [16]. As shown in Figure 2, in 2018, the oil palm plantation areas in the northern, northeastern, central, and southern regions of Thailand were 13,200 hectares (1.44%), 24,200 hectares (2.62%), 87,900 hectares (9.54%), and 79,300 hectares (86.40%), respectively. The percentages of FFB harvest were 0.58, 1.22, 7.77, and 90.43%, respectively.
2.2 Oil palm cultivation
Thailand’s oil palm plantation area continued to grow steadily from 1982 to 2018. In 2015-2016, owing to the El Niño phenomenon, the production decreased slightly, but quickly recovered in 2016-2017. The oil palm plantation area has grown by about 4.5% over the past 10 years, as shown in Figure 2. An area of 800,000 hectares was planted to oil palm in the southern region alone in 2018, accounting for 86.40% of the country's total plantation area. In 2018, Thailand's total annual FFB production was 15.39 million tons. The FFB harvest was 13.918 million tons in the south, 1.195 million tons in the center, 188,000 tons in the northeast, and 89 thousand tons in the north. The annual harvest of FFBs per hectare in Thailand is 3024 kg [15].
2.3 Production, harvesting, and processing in Thai oil palm industry
Thailand’s palm oil processing industry chain is complete, mainly including oil palm plantations, CPO extraction and processing, CPO refining, and biodiesel production. Thailand has about 240,000 family workshops participating in oil palm plantation (upstream), CPO processing mills (midstream), and palm oil extraction facilities (downstream). Among the family workshops, 79% are small [5].
The production cost of palm oil in Thailand is higher than those in Indonesia and Malaysia, sometimes as high as 110%. Therefore, Thailand's palm oil export has no advantage. About 75% of the annual palm oil produced is used for domestic consumption, exports only account for 11%, and the remaining 14% is kept as palm oil inventory. Of the palm oil consumed in Thailand, 49% is used for biodiesel manufacturing and 32% is used for household cooking.
3. Methodology
3.1 System boundary of the study
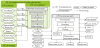
In this study, we combined two environmental sustainability assessment tools, namely, life cycle greenhouse gas (LC-GHG) emission assessment and ecological footprint assessment, to assess the environmental sustainability of oil palm cultivation in different regions of Thailand. In this study, we calculated the total greenhouse gas emissions from the production, transportation, processing, and waste disposal in the palm industry, as well as the ecological footprint of the palm planting process. Figure 3 shows the scope of the greenhouse gas and ecological footprint assessments, including the 25-year economic life and raw material transportation of palm nursery plants and palm plantations. We also investigated the types of land use before the conversion to new oil palm plantations and the areas planted after 2006 [1,2,4].
3.2 Technology
The oil palm cultivation system is mainly composed of seedling cultivation and oil palm cultivation. The cultivation of oil palms starts from the seeds. The seeds are sown in small plastic bags containing soil and organic matter and cultivated for 3 to 4 months. After that, the seedlings are transplanted into larger polyethylene plastic bags until they are 12 or 13 months old, at which they are ready to be transplanted to the plantation. In this process, the soil is prepared first with careful and regular application of water and fertilizer. The palm density of a plantation is 130-140 trees per hectare. Oil palm trees begin to bear fruit bunches 2-3 years after planting in the field, but the first harvest is 5 years after planting. The economic life of oil palm is about 25 years, and the frequency of a harvest cycle is about 10-15 days or 2-3 times a month. At present, fruit bunches are harvested mostly by hand in Thailand. Although mechanical harvesting is highly efficient, it affects the quality of the fruit bunches. Trucks and other items of agricultural equipment that require fossil energy are used during transportation [1,18].
The production of CPO mainly consists of two processes, wet extraction and dry extraction. Wet extraction has high production capacity and part of the shells produced during the production can be reused as fuel. In this research, we mainly studied the Thai wet extraction process. The wet extraction of crude palm oil from FFBs mainly includes five steps: 1) preliminary processing, 2) pressing, 3) drying, 4) wastewater treatment, and 5) public processing. The palm ears are sent to a virgin oil plant for retorting and sterilization within 24 hours after being picked. The fruit stalks are separated, and the fruit is placed in a silo for oil extraction and oil purification. The wet extraction process requires large amounts of water, energy, and chemicals. In palm oil production, FFBs are used as the raw material, CPO is the main product, and palm kernels, palm kernel oil, and husk are the common by-products. The EFBs and palm oil mill effluent (POME) produced by the wet extraction process are classified as waste, as shown in Figure 3. The wastewater generated by wet extraction is discharged to wastewater treatment equipment. The conventional method of wastewater treatment involves the use of a stable tank composed of an anaerobic tank, an aerobic tank, and a retention tank to treat wastewater. The treated wastewater is discharged into the oil palm field or stored in a detention pond. At present, the wastewater treatment facilities of palm oil plants have been upgraded to biogas systems [18,27].
In this study, the ecological footprint (EF) evaluation index is combined with the greenhouse gas emissions during an oil palm life cycle to evaluate the sustainable development of the Thai oil palm industry. It must be clarified that even though the system boundary of this study is the same as that studied by Suttayakul et al. [2], in our study, we considered the environmental impacts using the ecological footprint evaluation index. This work is the first to combine the environmental impacts of oil palm plantation nursery and oil palm cultivation on the total land and water ecosystem demand for providing resources and absorbers of emissions with greenhouse gas emissions. The use of fuel and electricity is converted into energy EF. The use of materials, fertilizers, and chemicals is converted into carbon dioxide emissions, which is in turn converted into forest EF. Water use is converted into forest EF. The use of plantation farmland is converted into arable land EF. The total EF is the sum of energy, forest, and arable land EFs, as shown in Figure 2. The study by Suttayakul et al. [2] only focused on the impact of water use on oil palm plantations, whereas the study by Charongpun et al. [4] did not focus on the impact of greenhouse gas emissions. In this study, EF was selected for evaluating oil palm plantations because it can be used as an independent indicator of life-cycle environmental impact, as well as a screening indicator of environmental performance [29].
3.3 Calculation methods for greenhouse gases and EF
The oil palm life-cycle chain includes oil palm plantations, factories for crude palm oil (CPO) extraction, and refineries for edible oil and biodiesel. The stress on resource use can be evaluated by comparing the ecological footprint (EF) with the carrying capacity of the planet. The EF represents all the land and water ecosystem requirements for providing resources and absorbers of emissions in terms of global hectare (gha) [29]. In 2016, Thailand’s per capita EF was 2.5 gha and per capita BC was 1.2 gha. Therefore, the biocapacity deficit is 1.3 gha. The lack of biocapacity mainly comes from the carbon footprint component in the ecological footprint assessment. Therefore, Thailand must use resources elsewhere to maintain the lifestyle of the country’s current population. In addition, Thailand needs to improve production efficiency to balance EF and BC. The continuous development of the palm oil industry in Thailand will inevitably promote the continuous increase in Thailand's EF. At present, Thailand's EF is higher than its BC. The expansion of oil palm cultivation may increase the pressure on the use of resources in the region. To enhance sustainable oil palm planting, it is necessary to use EF as an indicator for the zoning of oil palm plantations. The EF represents the requirements of the land and water ecosystem, and one of the indicators is the provision of resources and absorbers of emissions. One of the benefits of planting crops is the possibility of expanding crop production. In addition, the ratio of benefits to EF can be used to represent global benefits and environmental impact. The system boundaries are shown in Figure 3.
3.4 EF of oil palm plantation
The method of calculating EF is shown in Equation (1). EF is defined as the sum of the EFs of direct and indirect land, water, fuel, and power applications, CO2 emissions, and chemical and material use.
EFdirect is the EF for direct land occupation, and EFindirect is the EF for indirect land occupation. EFdirect can be obtained by calculating the EF of the cropland as
EFcropland is the utilization of farmland, S is the consumption of the surface area, and ep is the equivalent factor.
EFindirect mainly includes forest EF and energy EF. The EF of forests can be calculated from farmland water and CO2 discharged from fertilizers and materials. The EF of energy can be calculated from the use of fuel and electricity as
The EF of water use is calculated as
where W is the water consumption (m3), FP is the forest production (m3/ha/year), and ef is the forest equivalent factor. The EF of CO2 emitted during the use of fertilizers and materials is calculated as
where Cmi is the fertilizer and material consumption (kg), is the emission factor (kg CO2 equivalent, eq/kg), 0.266 is the value for one ton of CO2 that needs to be stored in the area, and ef is the equivalent factor of the forest. The EF of fuel use is calculated as
where F is the fuel use (GJ), EP is the energy consumption of fuel (GJ/ha/year), and ef is the equivalent factor of the forest. The EF of electricity is defined as
where Pi is the primary energy consumption (GJ), EPi is the energy productivity, and ef is the equivalent factor of the forest. To analyze the ratio of benefits to EF, the cost of palm oil and oil palm plantations in Thailand from 2009 to 2017 was obtained from the Office of Agricultural Economics [6]. The selling price of FFBs from 2009 to 2017 was obtained from the Ministry of Domestic Trade of Thailand.
3.5 Data collection
In this study, the data on the oil palm cultivation process were divided into two categories. The first category included the data related to the oil palm planting system, including palm seedling cultivation, land preparation, plantation management, harvesting, and material transportation. The data in this category were mainly collected from palm oil plantations. The second category included data related to the production of energy, fertilizers, and agrochemicals used in the cultivation system. These data were from the Thai National LCI database, Ecoinvent database [30], and literature.
For palm oil processing, we analyzed the CPO production capacity of 32 palm oil processing plants in Thailand, which is about 50-95 tons of FFBs per hour. When calculating greenhouse gas emissions of palm oil processing, we used the numbers of inputs and outputs involved in the transportation process and waste disposal. EFs represent the value of converting these quantities into greenhouse gas emissions.
In the calculation of the ecological footprint, the life cycle inventory (LCI) data of oil palm plantations were from Thailand’s national LCI database. In this study, we merged the data of eastern Thailand and central Thailand.
4. Results and Discussion
4.1 Greenhouse gas calculation method
In the process of palm planting and crude palm oil production, land use conversion will affect the overall carbon balance, and planting crops can also sequester carbon. Most of Thailand’s planted forests were converted from farmlands, so in this study, we do not consider land use carbon emissions caused by this conversion. In this study, we established a "global warming assessment of palm oil production" model based on the obtained data, and we determined the system boundaries of the model calculation, as shown in Figure 2. The model shows and links all the fields and processing activities required to produce CPO in a crop life cycle and estimates the greenhouse gases produced by these activities. The standard Intergovernmental Panel on Climate Change (IPCC) conversion factors was used to convert GHGs into carbon dioxide equivalent (CO2 eq). According to the carbon sequestration in crops and crop processing and the average value of CO2 emissions and sequestration in a crop cycle, CO2 eq/ha and CO2 eq/t CPO are obtained. The crop cycle length is fixed at 25 years. There is no clear evidence that the soil organic carbon (SOC) level continues to change during the crop growth cycle, so SOC was assumed not to change. In this study, we assessed in detail various factors involved in the production of palm oil, including transportation, fertilizer use, and the amount of CH4 generated from palm oil plant wastewater, and we linked the amount of nitrogen fertilizer used with the output of FFBs. The net amount of carbon dioxide per hectare per ton of palm oil and the net amount of overall CO2 emissions from the Thai palm oil industry were calculated [6-16].
EFFB come from FFB production and FFB transport, as shown in Equation (8). FFBs are directly transported from palm plantations to palm oil processing plants or from palm plantations to FFB collection points and then transported from the collection points to the palm oil processing plants. All transportation processes are included in the calculation.
During palm oil production and processing, the amount of greenhouse gases emitted from chemicals mainly includes Echemical, production, Echemical, transport, Echemical packaging, production, Echemical packaging waste, transport, and Echemical packaging waste, disposal, as shown below.
The greenhouse gas emissions form the mill mainly come from the burning of fossil fuels and the use of electricity for energy, which include EFuel, production, Efuel, transport, Efuel, combustion, and Eelectricity as shown below.
Shells are generally sold as biofuels. Therefore, greenhouse gas emissions from shells are close to zero.
The greenhouse gases emissions from the wastewater treatment system were calculated in this study by the UNFCCC method [14]. In this study, we mainly calculated for the situation where there is no biogas recovery device in the wastewater treatment system, as shown below.
For the mills without a biogas recovery device, greenhouse gas emissions mainly include EWastewater, treatment, Esludge, treatment, Ewastewater, discharge, and Esludge, final.
Treated wastewater is used for oil palm plantations or reservations. When no wastewater is discharged to natural water sources, the amount discharged is considered zero. Regarding the use of treated wastewater in oil palm plantations, that is, only after anaerobic degradation of the wastewater, the treated wastewater can be absorbed and used by palm trees. It must be pointed out that the nitrogen present in the treated wastewater may be the source nitrous oxide emission. However, the nitrogen content in the treated wastewater can be controlled in the wastewater treatment plant, which precipitates the waste residues from the biogas system in a series of anaerobic tanks. If there is no sludge treatment, ESludge final and ESludge treatment are regarded as zero. If there is no biogas recovery system in the waste water treatment system, greenhouse gas emissions mainly include EWastewater, treatment, Esludge, treat, EWastewater, discharge, and Esludge, final. As mentioned earlier, ESludge, treatment, EWastewater, discharge, and ESludge final are considered zero. Therefore, in this case, only EWastewater treatment is calculated as
Qww,I,y: Volume of wastewater treated in wastewater treatment system
i in year y (m3)
CODremoved,I,y: COD removed by treatment system i in year y (kg/m3),
measured as the difference
between the inflow COD and outflow COD in system i
MCFww,treatment,BL,i: Methane correction factor for wastewater treatment
system i
BO, ww: Methane production capacity of the wastewater
UFBL: Model correction factor to account for model uncertainties
GWPCH4: Global warming potential for methane
Therefore, the total of greenhouse gas emissions in this study is calculated as
Finally, we calculated the greenhouse gas production of each part of palm oil processing. Palm oil plants produce not only CPO but also husks, fibers, and palm kernels in the process. After calculating and determining the total greenhouse gas emissions in this process, the CPO, palm kernel, husk, and greenhouse gas emissions are categorized according to their respective proportions [16,19]. Fiber and empty husks are biomass waste. Fiber is generally used as biomass fuel in boilers. In this study, the combustion of fiber belongs to the cycle within the boundary of the research system. Therefore, the greenhouse gas emissions fiber can be regarded as 0. FFBs are regarded as organic waste and are used in mushroom cultivation and boiler power generation in Thailand.
Through the above calculation, the main part of greenhouse gas emissions is determined. Emissions from energy consumption, FFB production and transport, wastewater, and additional operating supplies and inputs must be considered.
The conversion formula of the greenhouse gas carbon equivalent is
4.2 Greenhouse gas emissions from the palm oil industry
4.2.1 Greenhouse gas emissions from seed cultivation and FFB harvest
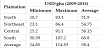
Table 1 shows the greenhouse gas emissions the four major palm growing regions in Thailand. Greenhouse gas emissions are expressed as CO2 equivalents emitted per ton of harvested FFBs.
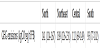
According to calculations based on available data, palm planting in Southern Thailand has the highest greenhouse gas emission (CO2 equivalent per ton FFBs), 189 kg CO2eq/t FFBs. The southern region has the smallest emission of 93 kg CO2eq/t FFB. The amount of greenhouse gases emitted per ton of FFBs harvested in northern Thailand is significantly higher than those in the central and southern regions. Among them, the amount of greenhouse gases emitted from the chemical fertilizers used for the palm trees accounts for the main part of GHG emissions in palm oil plantation. As mentioned above, the area of palm plantations in southern Thailand is relatively large, but compared with the south, the northern region uses more energy and materials for palm planting and FFB harvesting [1].
4.2.2 Greenhouse gases CPO production and processing
The CPO production and processing conditions in the four palm plantation regions are same (the CPO processing plant in the south is closer to the plantation, and the amount of greenhouse gases emitted during transportation is approximately 0). In all these regions, there is no biogas recovery. The amount of greenhouse gases emitted by producing 1 ton of CPO is shown in Table 2.
From this table, we can see that for CPO production and processing, the CO2 equivalent of each ton of CPO produced is 1,000.43 kg, and the greenhouse gas equivalent emitted from the biogas is relatively high. The table also shows the CO2 eq from by boiler combustion.
4.3 EF in Thailand's palm oil industry
4.3.1 EF of palm plantation (FFBs)
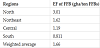
The EF of palm plantation is shown in Table 3. The EF of palm plantations in southern Thailand is the smallest, about 17.58 gha/ ha-year. For plantations in northern Thailand, the EF is determined to be 24.59 gha/ha-year. Planted forests in northern Thailand consume the most resources per unit area. The oil palm plantations in northern Thailand have the highest EF, which may be related to water consumption and fuel and chemical use. Planted forests per unit area in the northern provinces require large amounts of water, especially irrigation water. Large amounts of chemicals are used in the central region because cultivators prefer to use herbicides to remove weeds instead of manually removing them in Chonburi Province [2]. The average EF of Thai oil palm is 21.6 gha / ha-year. The average EFs for the annual oil palm planting area per hectare are 0.686 gha for energy, 20.52 gha for forest, and 0.402 gha for farmland (Table 3). The EF of the forest mainly comes from the use of rainwater in the plantation, followed by irrigation water and fertilizer. Fuel is the main source of EF of energy for oil palm plantations. The EFs of electricity, materials, and chemicals are relatively low. The southern provinces consume the lowest resources. The soil and climatic environment in southern Thailand are more conducive to palm tree planting than the northern areas. Therefore, in terms of palm planting, the EFs of plantations from north to south in Thailand are gradually decreasing [29].
4.3.2 EF and greenhouse gas emissions FFBs
The maximum EF used for FFB production in Thailand's four palm growing regions was determined. The production of FFBs per unit area in northern Thailand requires relatively larger amounts of fertilizers and irrigation water, whereas that in other regions requires smaller amounts. The FFB production in southern Thailand is 506.4 kg FFB per hectare, whereas those in the northern and northeastern areas are 188.3 and 234.6 kg/ha, respectively [15]. The average EF of FFB is 1.66 gha/ton FFBs in Thailand (Table 4).
As shown in Figure 4, in the palm cultivation and FFB harvesting in Thailand, the southern region has a high overall greenhouse gas emission owing to the extensive planting areas. However, as shown in Table 1, the greenhouse gas emission for every ton of FFBs harvested in southern Thailand is 93 kg, and the EF value per hectare of plantations in the southern region is also the smallest. Overall, the oil palm plantation in southern Thailand requires the least ecological resources and emits the least amount of greenhouse gases per unit area.
4.3.3 Ratio of plantation forest income to EF
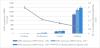
The ratio of the economic benefits of plantations to EF represents the benefits of using the land and water ecosystems obtained from oil palm plantations to provide resources and absorb emissions. A grower’s net income from economic gains in dollars per hectare-year and EF in ha/ha-year are used to calculate the ratio of plantation revenue to EF [4,29]. This ratio can be seen as an indicator that supports the decision to expand crop planting. In the same area, in principle, priority should be given to providing crops with a high ratio of economic benefits to EF. FFBs from oil palm plantations are used to produce CPO. Then, the CPO is refined to produce edible oil and biodiesel [17]. Most cooking oil and biodiesel are consumed locally in Thailand. Therefore, the government can formulate some policies to control the balance between product demand and supply. In addition, the production of oil palm plantations in Thailand has gradually increased from 2009 to 2018 [6-15]. The increase in yield has an impact on the benefits for the growers, resulting in smaller changes in the ratio of benefits to EF. Table 5 shows the ratio of economic benefits of Thai oil palm industry to EF.
Table 5 shows the average ratios of economic benefits of oil palm plantations to EF in the northern, northeastern, central, and southern regions from 2009 to 2018, which were 51.9, 54.75, 58.15, and 68.8 USD/gha, respectively. It can be said that the oil palm plantations in the southern region have brought the greatest benefits to planters, because compared with other regions, the ratio of economic benefits to EF of plantation in the southern region is higher, and FFB production is also high. The plantation in the northern region has the lowest profit per hectare and the lowest yield, considering that plantation in the northern region requires large amounts of water and fertilizer. Because the soil and climatic environment in southern Thailand are more conducive to palm tree planting than those in the north, Thailand's water and fertilizer inputs from the north to the south are gradually decreasing. The economic value of palm planting basically conforms to this frond, that is the economic value per unit area increases from the north to the south.
5. Conclusions
Thai oil palm plantations are mainly distributed in the southern region, followed by the central region. The northern and northeastern regions are relatively small, accounting for only 13.6% of the total area. The CO2 equivalent per ton of FFB harvested in Thailand's plantationsis about 133.8 kgCO2eq, and those in the north, northeast, center, and south are 141, 189, 112, and 93 kgCO2eq, respectively. The CO2 equivalent per ton of CPO produced by the palm oil processing plant in Thailand without using a biogas recovery device is 1000.43 kgCO2eq. The total CO2 equivalent of the oil palm industry in Thailand is about 4.342 million tons, accounting for about 1.44% of Thailand's annual carbon emissions, of which 29,800 tons is in the north, 71,000 tons in the northeast, 355,300 tons in the center, and 3,886,100 tons in the south. Although the total palm plantation area in the southern region is relatively large, the southern region produces the lowest unit CO2 equivalent during palm tree planting and harvesting palm fresh fruit bunches. The average EF of Thai oil palm plantations is 21.6 gha/hayear. The ratio of earnings to EF is 58.4 USD/gha. The ratio of revenue to EF in the southern region is 68.8 USD/gha. The EF of oil palm plantations in the southern region is relatively small, and the ratio of income to EF is the highest. This means that the southern region of Thailand has lower investment in oil palm planting than the other regions in Thailand. Palm planting requires greater investments on chemical fertilizers and energy, its cost is higher, and its CPO price is not competitive.
Competing Interests
The authors declare that they have no competing interests.
Author Contributions
Conceptualization, JJ. M. and T.F.; methodology, JJ.M. and T.F.; investigation, JJ.M.; data collection JJ.M., W.N and O.C.; data analysis, JJ.M.; writing-original draft preparation, JJ.M.; writing-review and editing, T.F and Y.L.; visualization, T.F.; supervision, T.F.