


1. Introduction
The importance of groundwater for living of human society cannot be exaggerated. 90% population of India is dependent on groundwater for drinking and other purposes. Unplanned urbanization, unrestricted exploration, unintentionally by domestic, agriculture and industrial effluents and dumping are the main cause of polluted water reservoir. Variation of groundwater quality in an area is a function of physicochemical parameters that are greatly influenced by geological formations and anthropogenic activities. India has diversified geological, climatological and topographic set up giving rise to divergent groundwater situations in different parts of the country. The quality of groundwater is described by its quantitative and qualitative characteristics such as suspended solids and dissolved minerals or organic compounds [1]. Development of the equilibrium results as changes in chemical hydrogeology by including many chemical thermodynamic concepts, including the Nernst equation, which is related to the electromotive force, pH, temperature and dissolved solids in groundwater [2]. Land use and land-cover changes have a huge impact on environmental and landscape attributes like the quality of water, land and air resources, ecosystem processes and function, and the climate system itself through greenhouse gas fluxes and surface albedo effects. Land use and land cover change is scalar dynamic. The change in land cover results by natural processes where as land use change is the manipulation of land cover by anthropogenic activities for example food, fuelwood, timber, fodder, leaf, litter, medicine, raw materials and recreation [3].
Geographical information systems (GIS) and remote sensing are well-established information technologies, the value of which for applications in land and natural resources management are now widely recognized. Current technologies such as geographical information systems (GIS) and remote sensing provide a cost effective and accurate alternative to understanding landscape dynamics [4]. Digital change detection techniques based on multi-temporal and multispectral remotely sensed data have demonstrated a great potential as a means to understanding landscape dynamics- detect, identify, map, and monitor differences in land use and land cover patterns over time, irrespective of the causal factors. Recent improvements in satellite image quality and availability have made it possible to perform image analysis at much larger scale than in the past [5]. GIS has enormous possible as an environment for the conception of dynamic models of physical environmental processes [6].
1.1 Statement of the problem
The present study reveals the possible relationship between fluoride and geological types and processes with respect to the suspected occurrence of endemic fluorosis. WHO data shows that in India about 62 million people are consuming excess of fluoride in drinking water. Approx one third of the country is denoted as drought risk zone, so water quality analysis is one of the most important aspects in groundwater studies [7]. The objective of present study is to discuss the physicochemical parameters of groundwater that is suitable for drinking and agricultural in hump belt of western Rajasthan (Bikaner, Kota, Jaisalmeir, Jodhpur, Barmer, Udaipur, Nagore) Rajasthan is classified as desert area where surface water resources are limited, with the result, groundwater is the only source of drinking water to the village population. Present research work attempts focused on analysis of groundwater quality by using conventional hydro geochemical methods and also to prepare the contour maps for the various water quality parameters by using Arc GIS software.
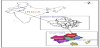
2. Location and Extent
The study area is the desert area of Rajasthan in India. The area falls in the Survey of India Topographic map number G43H3 (45D/10) to a scale of 1:50,000. Bikaner, Kota, Jaisalmeir, Jodhpur, Barmer, Udaipur, Nagore districts selected as study area. Groundwater in the study area occurs under water table to semi-confined conditions restricted to weathered and fractured formation. The study area contains deep aquifers. The groundwater quality analysis has been carried out for the water samples collected from the study area.
3. Research Methodology
3.1 Sampling technique
Water samples are collected by random sampling design from the study area. In this method every item of an object in the sample has an equal chance of inclusion. Random sampling ensures the “Law of statistical regularity”, which states that “If an average of the samples chosen is a random one, the sample will have the same composition and characteristics of the object under consideration”. So random sampling is considered as the best technique of selecting a representative sample. Acid washed polythene bottles used for fluoride analysis. The samples were preserved, cooled and protected from breakage while transporting the bottles to the laboratory. After arrival to the laboratory, the groundwater samples were analysed for physico chemical parameters, pH TDS total alkalinity, total hardness, EC, chloride and fluoride fluorides by following the standard methods prescribed as per IS: 10500-1994 codes.
3.2 Fluoride estimation
Fluoride estimation in drinking water was determined by electrochemical means using a fluoride ion selective electrode (Orion- 9609BNWP) coupled to an ion analyzer (Orion-4 Star). Before estimating the fluoride content in drinking water, drinking water was brought to a constant temperature of 25°C in a water bath and the instrument was calibrated using fluoride standards containing TISAB III which encompassed the range of the measurement to be made (fluoride standards were 1ppm F and 10ppm F). After the calibration was done, 50 ml of water was measured using a measuring beaker and to this 5 ml of TISAB III was added using a pipette which standardized the ionic strength and pH of the medium. The solution was stirred at a uniform rate until equilibrium was reached. Once the equilibrium was reached, the reading was recorded from the ion meter in ppm.
3.3 GIS mapping
A base map has been prepared using survey of India topographic sheets 1:50,000 scale from the toposheet locations are traced in tracing films, scanned geo referenced and digitized using ARCGIS 9.2 The groundwater contour analysis is done by using Arc GIS software. Geographic Information System (GIS) approach to develop spatial information and knowledge based on the ground water quality of study area.
4. Result
Total 77 ground samples were analysed for physic chemical parameters, it was Kota (5), Bikaner (7), Nagore (14), Jodhpur (15), Udaipur (17), Barmer (9) and Jaisalmeir (10) respectively. The pH indicates the acidic or alkaline material present in the water. The pH of the groundwater samples in the study area 7.14, 7.085, 7.1, 7.306, 7.188, 7.566, 7.18 Kota, Bikaner, Nagore, Jodhpur, Udaipur, Barmer and Jaisalmeir respectively. The groundwater in study area is slightly basic in nature. The average value of total dissolve solid and total alkalinity is under BIS values. The higher total alkalinity and TDS value of groundwater in certain locations in the study area may be due to the presence of bicarbonate and some chloride and sulfate salts. The alkaline water dissolves less metals within it.
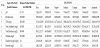
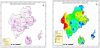
Electrical conductivity is the measurement of salt concentration in water samples. Excess salt increases the osmotic pressure of the soil solutions that can result in physiological drought conditions. The Electrical conductivity values varied 0.974±0.0162, 1.033±0.072, 0.896±0.052, 0.932±0.104, 0.857±0.068, 0.880±0.07 and 0.9366±0.0258 mhos/cm in Kota, Bikaner, Nagore, Jodhpur, Udaipur, Barmer and Jaisalmeir respectively. Increased concentration of ionic constituents in water samples results as high value of EC.
The Total dissolved solids observed in selected districts is 1711.6±150.89, 1178.857±85.216, 1477.4±316.71, 1888.28±267.81, 1903.33±576.072, 1740.322±452.72 and 1368.85±357.90 mg/l in Kota, Bikaner, Nagore, Jodhpur, Udaipur, Barmer and Jaisalmeir respectively. High value of Total Dissolved Solids causes negative impact on human health like gastro-intestinal irritation, kidney stones and heart diseases [8]. High concentration of TDS is due to the influence of anthropogenic sources such as domestic sewage, solid waste dumping, agricultural activities and some natural causes are weathering and influence of rock-water interaction.
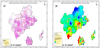
Total hardness is the result of the presence of cations like calcium and magnesium and anions such as carbonate, bicarbonate, chloride and sulphate in water. Water hardness has no such specific health impacts but it can be a reason of unpleasant taste, kidney stone and reduce the ability of soap to produce lather [9,10]. Hard water is unsuitable for domestic use. In all districts total hardness was beyond the limit 794.2±212.75, 634.85±64.97, 782.571±310.15, 814.4±102.37, 705±210.57, 805.88±100.66 and 746.2±79.28 in Kota, Bikaner, Nagore, Jodhpur, Udaipur, Barmer and Jaisalmeir respectively. Presence of high value of total hardness may be due to the depth of aquifer. Salts of calcium, magnesium analysed as total hardness in the groundwater. Calcium carbonate and sulphate are commonly found in rocks during weathering process it dissolve in water aquifer [11]. In addition, the shales, sandstone also contain calcium in the form of carbonate. Rapid industrialization and urbanisation are some common anthropogenic factors of increase in hardness of water.
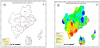
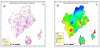
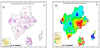
In semi arid and arid areas high concentration of chloride in ground water is a very common problem, high temperature and less rainfall is the main cause for chloride contamination. Soil porosity and permeability also is a key factor for high chloride concentration. Although, the chloride plays an important role in balancing level of electrolyte in blood plasma, but higher concentration can produce some physical disorders. The chloride concentration in the study area was 214.1±56.61, 247.89±52.83, 367.708±164.52, 429.13±150.74, 396.954±156.236, 331.686±65.71 and 302.688±87.91 in Kota, Bikaner, Nagore, Jodhpur, Udaipur, Barmer and Jaisalmeir respectively. The spatial distribution map and integrated GIS image for chlorides concentration for the study area is shown in Figure 7(B).
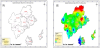
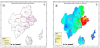
Fluoride is a trace element in groundwater; it accumulates in the bones, teeth and other calcified tissues of the human body. The major sources of fluoride in groundwater are fluoride bearing rocks such as fluorspar, cryolite, fluorapatite and hydroxylapatite (Agarwal et al., 1997). High intake of fluoride causes dental, skeletal and non skeletal fluorosis. The fluoride availability in ground water in mg/ litre has been used for the preparation of fluoride contamination map using IDW (Inverse Distance weighed) method available in Arc GIS. Fluoride availability in groundwater varied 2.482±1.039, 4.221±3.147, 14.168±7.929, 5.409±6.327, 3.904±2.172, 3.947±3.264 and 3.854±3.188 in Kota, Bikaner, Nagore, Jodhpur, Udaipur, Barmer and Jaisalmeir respectively. The permissible limit of fluoride in drinking water is 1.5 mg/l as per BIS standards. Clinical research shows that adequate intake of calcium and vitamin C reduces the risk of fluorosis. The spatial distribution map and integrated GIS image for fluoride concentration for the study area is shown in figure.
5. Conclusion
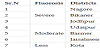
Geographic Information System (GIS) approach to develop spatial information and knowledge based on the ground water quality of Thar desert area of Rajasthan has been found to be very useful. GIS database also helps in decision-making process by identifying the most sensitive zones that need immediate attention. Only one district in study area found as less risk zone (Kota) while 3 districts were in moderate (Udaipur, Barmer, Jaisalmer) and 3 districts were in severe category (Bikaner, Nagore, Jodhpur). The fluoride concentration was exceeded in all the ground water samples from the permissible limit (1.5mg/l). The concentration of physiochemical constituents in the water samples were compared with the Bureau of Indian Standards to know the suitability of water for drinking. The ground water samples were slightly alkaline in nature and due the presence of high concentration of calcium and magnesium salts they were denoted as hard water.
Competing Interests
The authors declare that they have no competing interests.
Note: Graphy Publications remains neutral with regard to
jurisdictional claims in published maps and institutional affiliations.