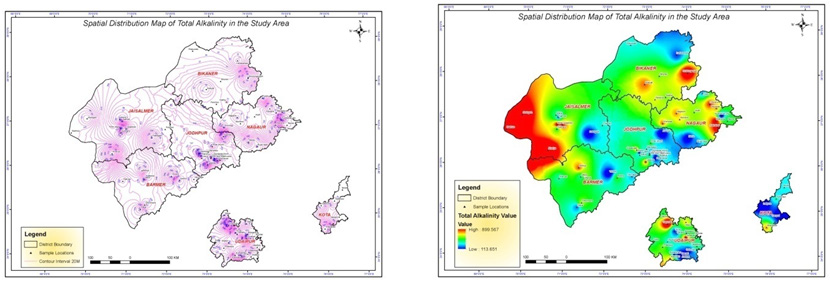
Figure 5:
Spatial Distribution Map and GIS image of Total Alkalinity in the Study Area.