


1. Introduction
In a previous study [1], non-edible plant seeds were sought as sources of vegetable oils as alternatives to soybean seed which is the major source of oil feedstock for the manufacturing of biodiesel in the United States of America. It is known that soybean as a resource also doubles as a staple food: it is the most widely consumed cooking oil (frying, baking and a condiment in salads). Commercially, soybean oil is also used in printing ink and oil paint formulations because as a drying oil, it slowly hardens upon exposure to air, forming a flexible, transparent and water-proof solid on most surfaces. Hence the motivation for the search for other oil sources especially from the non-edible/non-staple sources. In this study, several plant seeds which were selected based on their ease of cultivation and short maturation periods were investigated for the yields, densities and the degrees of saturation and compared to the soybean output as a benchmark.
A further investigation is undertaken in the present study to compare the viscosity and CP of the benchmark soybean oil and non-edible oils that compared favorably to the soybean oil in terms of the yields and Iodine Values (IV). In fact, the viscosity and the other properties of vegetable oils are strongly correlated to the IV. For example, the viscosity, Cloud Point (CP), Cetane Number (CN) and the Heat Values (HV) decrease as the IV increases [2].
The viscosity is a function of temperature which measures the resistance to flow of a liquid due to internal friction of one part of a fluid moving over another [3]. Generally, the viscosity of a Newtonian fluid increases as the temperature decreases leading to larger fuel droplets, poorer vaporization and narrower injection spray angle in the fuel injector [4]. Therefore, oil viscosity is a very important metric in the determination of the cold flow properties of biodiesel.
It is desirable that biodiesel remains liquid below the freezing point. However, the execution of viscosity measurements a temperature range becomes very difficult. Viscosity models can facilitate an exploration of the viscosity at low temperatures. Many viscosity models are consistent at high temperatures (> 10oC) but are not extended beyond these limits [3,5,6]. In this work, several viscosity models are extended to the critical region of low temperature and their accuracy is compared to a new viscosity model. The goal is to establish a viscosity model trained on data obtained at high temperatures (> 0°C), which can make accurate predictions in the critical region of low temperatures (< 0°C). It is assumed that the region of validity for the viscosity predictions is bounded by the CP which varies for different kinds of oils.
The CP is the temperature at which the least soluble biodiesel component crystallizes from solution [2]. Therefore, in a 100% pure biodiesel, the CP is determined using the type of fatty acid esters (vegetable oil) that make up the biodiesel or when comparisons are made of the various oil feed stocks that can be used in the production of biodiesel. Furthermore, another two important cold flow properties – the Pour Point (PP) and Cold Filter Pour Plug (CFPP) – were found to be strongly correlated to the CP [2]. As a result, the CP of the oils is used as an indicator of the flow capabilities of the biodiesel at low temperatures.The paper is divided into sections as follows. The viscosity measurements are described in Sec. 2, viscosity results are presented in Sec. 3.1, model fits and coefficients are shown in Sec. 3.2, and the CPs of tested oils are highlighted in Sec. 3.3. The conclusions are made in Sec. 4.
2. Viscosity Measurements
In this study, the chemical compositions of the oils were not determined. Nonetheless, it is expected that the sample oils have different compositions, hence different viscosities. The oil samples included in study were obtained from the seeds of the following non-edible/non-staple plants: Black-Eyed-Susan, Lavender, Bachelor- Button-Cornflower, Peanut, Morning Glory, Pecan, Shasta-Daisy, and Wild-Sunflower. Soybean oil and commercial Vegetable oil (Wesson) served as benchmarks in the study.
The viscosities were measured using SV-10 Vibro Viscometer. It is a sine-wave vibrational viscometer with an accuracy of 1% for repeated measurements. Viscometers with sensor plates operating at a low frequency of 30 Hz and an amplitude of less than 1 mm are suitable for sensitive applications since they apply very little load to the samples.
3. Results
Figure 1 shows the extracted oils in graduated tubes from the seed samples. It can be observed that the oil colors range from a bright yellow to brownish yellow representing the variation in the impact of the color on the seed color.
3.1 Viscosities
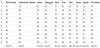
Viscosity data were determined at 11 temperature points in the open interval, (0-60oC). The viscosities were measured in the dimensions of Centipoise (cP) which is equivalent to milli-Pascal-second (mPa-s). Table 1 shows the measured data for the sample oils. All listed values belong to the first category measurements.
3.2 Fitting models
The present study’s focus is for temperatures below 20oC in order to estimate oil (biodiesel) cold flow properties. Preliminary results from existing models did not represent the expected experimental data well in the region of interest. As a result, a new model was developed. The experimental data were fitted with established viscosity models as follows.
The proposed model is defined as:
SCSU model:
The As, Bs, Cs, Ds and E are coefficients to be determined using the measured data. The statistical package in MATLAB was used to obtain the fitting coefficients for each oil sample. Table 2 shows these coefficients and the Root Mean Square Errors for each model for each oil sample.

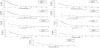
With the coefficients in Table 2, the viscosities versus temperature fits were plotted for the four models on the same coordinate system for each oil sample. Experimental data were also super-imposed on these plots. Figures 1.a)-i) show these plots. The purple, green, and teal dashed lines represent the Vogel, Andrade, and Anand models, respectively. The solid black line represents the SCSU model.
The “crosses” and “circles” represent experimental data points. The “circles” represent the training set used to fit the models while the “crosses’ represent the test set used to validate and compare the models in the region of interest. The following are the initial observations from the plots:
The four models fitted the data very well in the interval of measurements used for fitting (“circles”) and converged at high temperatures. Thus, the viscosity profiles above 40oC do not yield any significant information.
The models diverge at lower temperatures (<10oC) becoming more stochastic likely due to a change in phase (solid-liquid mixture), the rate of solid formation, and the viscosity model’s simplicity.
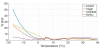
Due to the observed divergence, it could not be determined which of the existing models could realistically predict the viscosities at low temperatures, thus prompting the development of the SCSU model. Further experimental data were acquired in the interval (-20°C – 0°C) in order to validate the degree of accuracy of the models. These experimental data points were obtained for the Lavender oil. It can be observed from Figure 1.a) that the SCSU model is the most accurate of all the models applied. Figure 2 shows the percent errors of the viscosity models for the Lavender oil. The maximum percent error occurred for the Anand model (51.01%) whereas the minimum percent error (5.13%) was given by the SCSU model.
3.3 Cloud point
The experimental results were used to infer the cloud points of the sample oils. It should be noted that the CPs were estimated empirically. However, the rough estimates were easily made as the wax formation was evident during the temperature variations. The following observations were made during the process:
Peanut oil becomes entirely solid at relatively high temperature (around 0°C). The CP was estimated at 5°C.
The behavior of Pecan oil and Bachelor button-cornflower oil was consistent well below 0oC. Their CPs were estimated at -10°C.
The CPs of the Wild Sunflower and Black-eyed Susan were inferred to be -5°C.
Lavender oil viscosities were measured from -17°C. From the plots, Lavender oil appears as a special case: it does not form solids at temperatures as low as -17°C and it does not show any signs of unpredictable behavior in the range from -17o to 50°C.
The CP of Shasta Daisy oil was inferred to be -8°C.
The Morning Glory oil viscosities were measured from 5°C. It can be observed that this oil changes phase at a relatively high temperature (the highest for all tested oils). Wax starts forming around 5°C so the CP is conservatively estimated at 8°C.
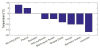
Figure 3 above shows a bar graph of the inferred Cloud Point temperatures for the analyzed sample oils. It is easily observed that the oils with CPs below 0°C are the most promising oils when compared with the soybean oil with a CP of 0°C.
4. Conclusions
The flow properties of the oil samples from non-edible/non-staple plant seeds were investigated by measuring their viscosities and analyzing the behavior of their viscosities at low temperatures. This behavior is expected to measure the abilities of the oils to flow freely in cold temperatures when used as feed stocks in the manufacture of biodiesel. Their cold temperature behavior was compared to that of the Soybean oil as the benchmark.
In this study, different mathematical models were applied in the fitting of the measured viscosity data. However, since the models did not adequately represent the data in the region of interest (lower temperatures), a new mathematical model was developed which in combination with measured data was used to infer the Cloud Point temperatures of the oil samples. The new model was validated with Lavender oil viscosity data. Lavender oil is unique among the oil samples. It does not form solids at temperatures even as low as -17°C; it does not show any signs of unpredictable behavior in the range -17 to 50°C (Figure 1.a)).
The inferred Cloud Point temperatures ranged from -17°C for the Lavender oil to 8°C for the Morning Glory oil. For the benchmark oil (Soybean), the Cloud Point temperature was inferred to be 0°C. Therefore, most of the samples had Cloud Point temperatures lower than for the benchmark. As a result, the non-edible/non-staple oil samples, Pecan (-10°C), Bachelor Button-Cornflower (-10°C), Wild Sunflower (-5°C), Lavender (-17°C), Black-Eyed Susan (-5°C) and Shasta Daisy (-8°C) are all possible replacements for Soybean as the oil feed stock in the production of biodiesel. However, the Morning Glory oil is determined to be a non-candidate since it forms solids at relatively high temperatures (5°C).
Competing Interests
The authors declare that they have no competing interests.