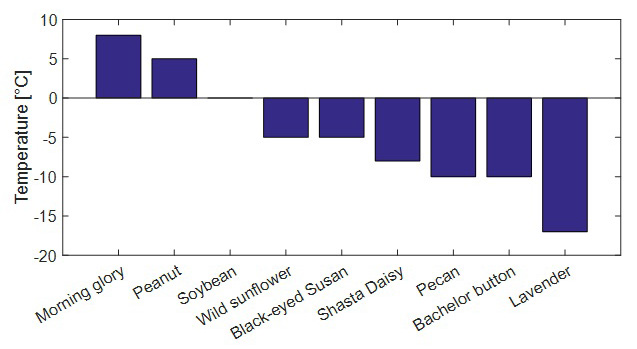
Figure 3:
Bar graph showing CP of selected oils.