


1. Introduction
Urbanization contributes to modifying hydrological processes when vegetation cover and soil are cleared from the land surface [1]. The more the imperviousness cover is, the higher the flood frequencies that may result. The expansion of urban areas results in decreasing infiltration of precipitation, increasing runoff, higher peak discharge, volume, and frequency of floods increase in nearby streams. During urban development, many stream channels alter its geomorphological characteristics which in turn can limit their capacity to convey floodwater. The severity and peak discharge of a flood are influenced by the intensity and duration of a storm, hydrological conditions preceding the storm, vegetation, topography, and geology of stream basins [2].
Green Infrastructure (GI) is a resilient approach that was developed to mitigate the negative impact of urbanization that includes increasing impervious cover by utilizing on-site practices to reduce stormwater runoff and enhance outflow water quality. These structures have been recommended as an alternative approach to better mimic the natural flow through using decentralized stormwater controls to reduce runoff at the source. GIs include bioretention, green roofs, rainwater harvesting, and permeable pavements [3,4]. Hunt et al., [5] showed through a study they conducted in North Carolina that the use of Bioretention area resulted in 96.5 % reduction in peak outflow for 16 storms with less than 42 mm of rainfall. They concluded that bioretention can effectively reduce peak flows for small to midsize storm events.
Although the effects of urbanization on watershed hydrology and river-channel morphology have been studied for decades as mentioned above, previous studies focused on a limited number of morphologic variables and ignored the complicating influence of varying GIs and designs [6]. There is still a great need to evaluate these practices and there is very little data on the potential impact of the adoption of GI practices at a watershed level. The recently available research evaluates the effectiveness of GI practices on a site scale using; field experiment, modeling or by developing a certain algorithm based on designed storms or average rainfall [7-10]. Several efforts contribute to analyzing the effectiveness of these practices based on pollutant removals such as nitrogen, phosphorus and total fecal. Other studies focused on the cost-effectiveness incentives of GI practices solely. However, there has been little research published on the influence of GI practices on a watershed scale. Bracmort et al. [11] studied the effectiveness of GI practices in the long run with respect to enhancing water quality. They ran several models using Soil and Water Assessment Tool (SWAT) to determine the long-term (20 years) impact of GIs on water quality for two watersheds. Results showed that GIs that were in a good condition (regularly maintained) reduced the average annual sediment yield by 16% to 32% and the average annual phosphorus yield by 10% to 24%. On the other hand, GIs in their current condition reduced sediment yield by 7% to 10% and phosphorus yield by 7% to 17%.
1.1 Goal and objectives
The overall goal of this research study is to evaluate the potential effects of urbanization on stream flood and to address the effectiveness of GI practices at a watershed scale. There is a great need to understand the functionality of GI practices, their ability to adjust the changes in land uses, and return peak flows to the pre-development scenario. This study is one of the very few studies that took place in the Blackland clay soil in Texas. Blackland clay soil consists of about 12.6 million acres of east-central Texas extending southwesterly from the Red River to Bexar County, which covers mostly the biggest cities in Texas; Austin, Dallas, San Antonio, and Houston [12].
1.2 Study area
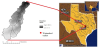
This study was conducted for the Blunn Creek Watershed located in Austin, Texas (Figure 1). The watershed area encompasses approximately 3.73 square kilometers, spanning the area from Town Lake (elevation 191 m above mean sea level [m.asl]) to headwaters (elevation 131 m.asl). Runoff in the Blunn Creek Watershed is associated with rainfall patterns [13]. The average annual rainfall in the watershed is 30 in (762 mm), and water temperature ranges between 13 and 22 °C with average bankfull flow rates equivalent to 2m3/s [14]. In general, the watershed falls in a humid subtropical climate with a very hot summer, reach the high on average 90s °F (34-36°C). During winter, the average daytime high is 61 °F (27 °C), while overnight low reaches or exceeds freezing 19 times per year [15]. Humidity in the watershed frequently fluctuates based on the shifting patterns of air flow and wind direction. It raises when air blows inland from the Gulf of Mexico and decreases significantly when air comes through the Chihuahuan Desert of West Texas [15]. The average wind speed is 5.1 miles per hour (8.21 km/hr) and this is formed over 7 months from Oct 30 to Jun 11 [16]. The land use in the watershed is distributed as follows; 34% residential, 21% businesses, 18% civic, 8% roadways, 21% undeveloped and 38% impervious cover [17]. The creek has a length of 3 miles (4.8 km), the census estimated total population living in the watershed area by 6,000 capita and the projection of 2030 might reach 6,810 capita [17]. Blunn Creek watershed was selected for this case study as it represents a typical high impervious watershed in the state of Texas with serious erosion and flooding problems. The watershed had a growing population but relatively small land. Hence, impervious coverages are expected to increase in the watershed, more runoff is expected to be generated. Hence, the successful experience to reduce the negative impact of urbanization needs to be studied so that it can be replicated into other parts of the state where we see urban flooding and hurricane becoming serious problems.
2. Materials and Methods
2.1 SWAT Model
Soil and Water Assessment Tool (SWAT) is a continuous and spatially distributed model designed to predict the impact of land management practices on water, sediment and agricultural chemical yields over long periods of time [18]. This study utilized the SWAT2012.10.4 version to run sub-hourly time step models. Traditionally, the model operated at a daily time step and it estimated the influence of land use and management practices on water, agricultural chemical yields in a watershed. The daily time step format provided by SWAT may not be sufficient to capture the impact of flashy storms where peak flows last for minutes only and are not reflected in daily average flows. It might also miss important processes such as the first flush of urban runoff. A sub-hourly model for urban applications was developed by Jeong et al., but is currently not widely used [19].
The Blunn Creek Watershed was first subdivided into sub-basins based on Digital Elevation Model (DEM) and channel network and later parameterized by a series of smaller modeling units, known as hydrologic response units (HRUs) according to topography, types of land use and soil.
There are two methods to calculate surface runoff using SWAT based on a time step of the model. Daily time step model estimates surface runoff by the SCS curve number CN method [20] (Equation 1).
where
Q is runoff (in)
P is rainfall (in)
S is the potential maximum soil moisture retention after runoff
begins (in)
Ia is the initial abstraction (in)
The sub-daily time step model uses the Green and Ampt Mein Larson (GAML) excess rainfall method [21].
where
f(t) is the infiltration rate at time t
Ke is the effective hydraulic conductivity
Ψ is the wetting front matric potential
Δθ is the change in moisture content,
F(t) is the cumulative infiltration at time t
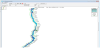
The underground water storage in SWAT can be estimated by using different ways like traveling distance, shallow aquifer, and deep aquifer. In this study, surface runoff was predicted based on GAML method since sub-hourly time step model is used. The Muskingum method was used for channel flow routing, and the Penman-Monteith method was selected to calculate potential evapotranspiration. The watershed was delineated into 14 subbasins and total stream flow volumes of runoff were evaluated at the outlet of the watershed (Figure 1).
2.2 Data Source
The following types of data were required to run a sub-hourly time step SWAT model: DEM layer, soil types and properties data, land use and land cover map and observed data for calibration and evaluation purposes.
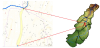
Models ran using 15 min rainfall data that were retrieved from a local weather station at the City of Austin. Daily temperature data from the Austin and Austin-Bergstrom NOAA weather stations were used, weather zone from (WGEN_US_COOP_1960_2010). The DEM for the watershed was a 3m integer which was developed by City of Austin based on [17] GIAR data. The land cover map was acquired from City of Austin and reclassified into five categories including residential, commercial, industrial, utilities and roads, and open space (Figure 2). Soil properties including texture, available water content, hydraulic conductivity, bulk density and organic carbon content for each layer were obtained from the Soil Survey Geographic database (SSURGO) that is distributed by the Natural Resources Conservation Service (NRCS). The HRU thresholds were defined by setting a percentage of 5% for the followings: Land use percentage over subbasin area, soil class percentage over land use area, and slope class percentage over soil area. The following types of land use were within the land use threshold exemptions and they did not receive any supplemental water by irrigation: parks and recreation, golf course, campgrounds, open space, and undeveloped areas.

2.3 Model Calibration and Validation
Hydrological data of 1998-1999 and 2001-2002 were obtained from USGS website for station No. 08157700 and used to calibrate and validated model parameters. An automatic calibration program interfaced with SWAT called SWAT-CUP was used to calibrate this study’s models. This program is designed to integrate various calibration/uncertainty analysis programs such as multi-site semiautomated inverse modeling routine SUFI2 [22] which was used in this study. The global sensitivity analysis procedure embedded in SWAT model through One-factor-At-a-Time (LH-OAT) [23] was applied and eight most sensitive parameters of the SWAT model were identified including ALPHA_BF (Base flow alpha factor), GW_ DELAY (Groundwater delay ), GWQMN (Threshold depth of water in the shallow aquifer required for return flow to occur ), CH_N2 (Manning roughness for main channel ), CH_K2 (Effective hydraulic conductivity ), SOL_AWC (Available water capacity of the soil layer), ESCO (soil evaporation compensation factor, and CH_K1 (Saturated hydraulic conductivity). The performance of each simulation was assessed by the Nash-Sutcliffe coefficient of efficiency, NS [24], computed as follows:
Where
Qo : observed discharge
Qm : modeled discharge
When computing the NS value, the first two years of simulation were always skipped, to avoid the influence of the initial conditions such as soil water content and eventually runoff estimates.
2.4 GI Representation in SWAT
Field experiments of two GI practices (bioretention area, and permeable pavement) were constructed at the City of Austin. Practices were installed and evaluated for one year with respect to reducing total runoff volumes. The integration of GI practices into SWAT model was based on these field experiments and to reflect real scenarios so that the performance of the modeled practices can be validated later as well.
A parking lot was designed to include two different types of pavements and a control. Three parking stalls of each type, forming one monitoring unit, are connected to an automatic sampler that collects runoff from all stalls. Each parking stall is 18ft x10ft. The three treatments are grass pavers, permeable interlocking concrete pavers, and impervious concrete (control). Runoff quantity is measured, and storage estimated. Rainfall is measured from a weather station (Campbell Scientific) on the property. A perforated drain runs the length of the stalls in the parking median.
A bioretention area was also constructed and curbs were cut to allow for runoff to drain to a forebay, which is a hundred square feet in area and about 1 foot deep on average for automatic sampling (ISCO 3700) and flow measurement (flume). Runoff was directed into the bioretention area (100ft x 20 ft). All runoff in the rain garden watershed was routed through the inlet flume. A surface overflow box drains water to an underground pipe to the first inlet of the detention pond. Moreover, the drainage layer of the rain garden had housed a perforated pipe that assists in soil infiltration. An ISCO flow meter was used to measure the overflow and perforated pipe flow and samples were collected with an ISCO 3700 automatic sampler.
It should be noted at this point that the current SWAT version SWAT2012 does not include bioretention or permeable pavement. One of the objectives of this study was to develop a methodology to account for these practices into SWAT model. The partial scale design was used in this study to simulate bioretention and permeable pavement. Two parameters were considered in adjusting the sedimentation filtration design: water ponding and depth of filtration media. A typical standard of a bioretention and a permeable pavement surface area that is 3 to 10 % of the total catchment area was followed. The initial run was executed with an automatic sizing function in order to size the pipes required to release runoff inside and outside the system. In order to minimize the function of the sedimentation basin and concentrate on a filtration basin only which represent the bioretention and permeable pavement, the following steps were followed: the surface area of the sedimentation area was selected to represent a forebay area that might be installed before a bioretention area and in case of the permeable pavement that was totally ignored by selecting a minimum number that the system would allow in order to minimize this effect, the outlet orifice pipe was selected to be bigger than the one for the filtration in order to divert most of the runoff to the filtration basin where it will be treated there, the depth of the filtration media for the bioretention was selected to be 1200 mm and maximum ponding depth of the water to be 420 mm, the depth of the filtration media for the permeable pavement was 356 mm and maximum ponding depth of the water was 10 mm. It is worth noting that ponding and filtration depths for both bioretention and permeable pavement were selected to represent field experiments for similar GI practices studied at the City of Austin. The field experiment of GI practices at the center was utilized later to judge the performance of modeled GIs in SWAT.
A bioretention area was installed in each subbasin and permeable pavements were considered to represent 27% of the total watershed. This representation for the permeable pavement was based on typical average parking lots in Dallas, TX downtown that has the same watershed area of Blunn Creek Watershed [22].
A hypothetical detention pond was designed according to the City of Austin standards. Pond sizes were calculated as follows: a raster surface was converted to contour lines with 1 foot (0.3 m) contour interval. The second step was to place a 12 m line segment at the end of subbasin 10 shown in (Figure 3) to represent the width of the detention pond across the creek. This width was based on the current geometry of the channel and could not be wider than a channel due to current development and residential areas adjacent to the channel. Following the contour line, an area of 3608 m2 was delineated which is the extended lines from the two ends of the 12 m segment line. The average operation depth along the pond is 3 m which were calculated directly from the geometry of the channel. A stepped weir was used and the height of it was based on the required storage volumes for the following design storms: (2 years, 25 years, and 100 years).
2.5 Flood Impacts
The first task associated with evaluating flooding in the Blunn Creek Watershed was to calculate the geometry of the channels for each subbasin. A cross-section analysis was conducted using HECRAS 4.1.0. FEMA floodplain map for the Blunn Creek Watershed was obtained from the City of Austin and imported into HEC-RAS for cross-section analysis. Multi river stations with a cross-section for each were developed by the software and exported for analysis. The total area of each channel was calculated directly in the cross-section view of HEC-RAS (Figure 4).
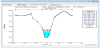
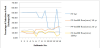
The stage-discharge analysis helped in determining areas that have narrow geometry and higher potential for flooding (Figure 5). The next task was to determine bankfull discharges for each subbasin. It is worth noting that most Blunn Creek channels are incised and do not represent the natural stream channels. Therefore, evaluating flooding based on exceedance of flows to floodplain is not feasible due to the fact that even the 100-year storm would not overflow channel geometry (Figure 4).
The general rule of thumb regarding bankfull discharges for natural channels is the peak for the 1.1-1.5-year storm [23,24]. For the purpose of this study and since Blunn Creek Watershed is considered highly urbanized, a 1.5-year storm was selected to represent bankfull discharges for each subbasin. Design storms for the following recurrence intervals (1.5-year, 2-year, 10-year, 25-year, and 100-year) were modeled for the SCS 24 hour rainfall distribution for type III region (Travis County) [25].
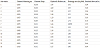
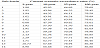
The evaluation sub-basins differed in physical and geological characteristics such as slope, soil type, and channel dimensions. These characteristics are listed in (Table 1), showing drainage area, hydraulic radius, slope and bank-full flow rate values at each sub-basin. SWAT was run using 15-min time step precipitation for different design storms and flooding was evaluated based on the frequency of flow exceedance over bankfull flow rates and reduction in peak flows.
3. Results and Discussion
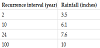
A Sub-hourly time step model was developed through SWAT 2012 and used to evaluate potential flooding for different recurrence intervals (2-year, 10-year, 25-year, and 100-year) for each sub-basin in the Blunn Creek Watershed. Table 2 below shows the equivalent inches of rain for each recurrence interval.
The model was calibrated for a 2 year period with 15- min and (R2= 0.78) and (NS =0.78). P-value and R2 were analyzed on a sub-hourly basis correspondingly for SUFI-2 uncertainty technique for the bestfit model. Validation procedures for the period between 2001 and 2002 were conducted to ensure the validity of the calibration process. NS value for validation was 0.67 and R2 value equals to 0.70 for the subhourly time step model. All in all, the comparison between observed and simulated streamflow showed that there is a good agreement between the observed and simulated discharge which was verified by higher values of R2 and NS.
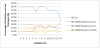
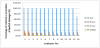
The impacts of GI practices were evaluated for the following scenarios: installing Detention Pond (DP) only, bioretention/Raingarden (RG) only, Permeable Pavement (PP), and a combination of PP and RG. Peak flow reduction percentages were calculated by comparing flows leaving out each sub-basin with GI practices to a scenario where no GI practices were considered (control). Adding RG only contributed to reducing on average peak discharges for all subbasin by 73%, 20%, 24%, 13% for the following recurrence intervals, 2-year, 10 -year, 25-year, and 100-year respectively (Figure 6).
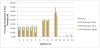
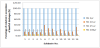
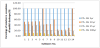
While combining RG and PP resulted in an average reduction in peak discharges for all sub-basins by 77%, 37%, 24%, 19% for the following recurrence intervals, 2-year, 10-year, 25-year, and 100-year respectively (Figure 7).
A detention pond was also evaluated in reducing peak discharges for all sub-basins in the watershed and reduction percentages resulted are 19%, 16%, 20%, and 18% for 2-year, 10-year, 25-year, and 100-year recurrence intervals respectively (Figure 8). Clearly, the impact of DP installation was very obvious in sub-basin 10 where it was installed and in the sub-basins that followed.

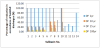
Adding PP also contributed to reducing peak discharges by 40%, 15%, 13%, and 11% for the following recurrence intervals, 2-year, 10- year, 25-year, and 100-year respectively (Figure 9).
The next level of evaluation of GI practices in reducing potential flooding for different recurrence intervals was based on exceedance of bankfull discharges. The exceedance percentage for the current scenario was calculated and compared other scenarios where GI practices were included. Clearly, exceedance percentages are increasing as we move from 2 year to 100 year as the amounts of flows increase (Table 3).
The effectiveness of GIs’ placement with respect to reduction in exceedance of bankfull discharges was studied for each sub-basin and for different recurrence intervals. For almost all scenarios and for all sub-basins, exceedance percentages dropped to zero percent when including any of the studied GIs. Though, PP had almost 100% reduction in the percentage of exceedance of bankfull discharges for the 2-year storm it had the least reductions percentages for the other recurrence intervals (Figure 10).
Adding RG only for each sub-basin in the Blunn Creek Watershed contributed to reducing average percentage of exceedance of bankfull discharges by 100%, 20%, 14%, and 3% for the following recurrence intervals, 2-year, 10-year, 25-year, and 100-year respectively (Figure 11).
The DP was placed at sub-basin number10 and that contributed to reducing the percentage of exceeded of bankfull discharges by 80%, 21%, 14%, and 6% for the following recurrence intervals, 2-year, 10- year, 25-year, and 100-year respectively. When we compare the DP performance with other GIs at the same subbasin and for the same design storm, we notice that DP is much capable of controlling large storm than all other GIs combined due to the fact the catchment and filtration are is bigger (Figure 12).
Combining PP and RG resulted in the greatest reduction in exceedance percentages for all design storms and subbasins among the other scenarios. On average, the percentage of reduction for the 2-year storm was 100%, the 10-year storm was 51%, the 25-year storm was 27%, and 8% for the 100-year storm (Figure 13).
4. Conclusions
The main objective of this study is to understand and quantify the performance of Green Infrastructure (GI) with respect to potential flooding. A sub-hourly 15-min time step SWAT model to increase the accuracy of simulations was applied to estimate flows and evaluate flooding in the Blunn Creek Watershed. Bioretention, permeable pavement and detention pond were the GI practices applied in this study. The current version of SWAT does not incorporate bioretention of permeable pavement in the pond file. These two practices were represented by modifying the routine of a sedimentation filtration design. Results showed that combining bioretention and the permeable pavement had the greatest reduction in peak discharges for all recurrence intervals (2-year, 10-year, 25-year, and 100-year). Permeable pavement had the least percentage of reductions for all recurrence intervals. All GI practices had 100% reduction in the percentage of exceedance for bankfull flows for the 2-year recurrence intervals. The same trend continued to hold and combining bioretention and permeable pavement resulted in the greatest reductions in the percentage of exceedance of bankfull flows.
Competing Interests
The author declare that there is no competing interests regarding the publication of this article.
Acknowledgments
I would like to express my sincere appreciation to Dr. Fouad Jaber at Texas AgriLife Extension Service/Texas A&M University, for his guidance and advice throughout this research and for providing financial support throughout my study in the graduate school.