


1. Introduction
South Asia is one of the fastest and leading urbanizing zones in the world with an area of about 4.5 million km2. It represents 3.31% of the world's land mass and has 22% of the world's population. According to the World Bank statistics, the South Asian population has increased from 1.13 billion to 1.76 billion from 1990 to 2016.Such increase in population has led to rapid urbanization and a pressure to convert natural and agricultural areas to residential and industrial land. This land use conversion has had a significant impact on the environment because of increased waste discharge, concentrated industrialization and intensive use of energy sources [1-4].
During the past two decades, the Colombo Metropolitan Area (CMA), Sri Lanka’s only metropolitan area and the country’s “heartbeat” (World Bank 2013), has experienced rapid urban growth. The World Bank report revealed that Colombo city, the core of the CMA, is one of the fastest growing cities in South Asia. The rapid urbanization and a lack of urban planning and land regulations led to a measurable decline and destruction of wetlands and farmlands in Colombo. As a result, the suburbs areas increased with a low-density pattern and excessive land use leading to the displacement of many native species and disruption of the existing ecosystem.
Increased temperatures associated with the Urban Heat Island (UHI) tend to exacerbate the threats to human health posed by thermal stress [5-8]. LST and UHI study in Colombo Senanayake et al., [9] found the UHI development in Colombo city centre during 2000 to 2001, yet, from the suburb areas have experienced a further and faster development since 2001. This development needs to be addressed in terms of UHI’s changes and its implication for a sustainable future and development of the CMA.
Since market-oriented economic reforms were initiated in Sri Lanka in 1978, Colombo has experienced rapid urbanization because of intensive economic growth and industrialization. This rapid urbanization led to changes from soft to a hard surface. This surface
change had an apparent effect on the water and soil quality because of heavy metals and organic compounds contamination [10,11]. The comparison of the integrated pollution index (IPI) of heavy metals in urban soils is higher than other areas [12]. Apart from the soil, Colombo canals, rivers and other open water sources have also been polluted with organic compounds and metals [13-15]. Although national and international environmental law and regulations have improved, water pollution is presently a pressing issue because it has not been at the forefront of local measures to stop or decrease its exposure to pollutants [10,16]. According to Sri Lanka National Water Development Report [17] pointed out a variety of quality concerns, including contamination by nitrate and bacteria in underground and surface waters mainly due to poor sanitation and untreated wastewater or insufficient wastewater treatment, toxic chemicals from industrial and agricultural activities, and eutrophication in lakes/ reservoirs (UNESCO and Mo AIMD 2006). There was no literature found testing the relationship between LULC and Environmental issue so it needs to identify such kind of relationship in CMA.
Apart from the aforementioned issues, the various problems and issues Colombo face today include increased density because of the increased population (including rural to urban migration) and increasing number of vehicles and related congestion; urban environmental degradation because of pollution, continuous construction expansion and loss of urban green spaces, among others. These will, undoubtedly, pose a barrier to the sustainable development in Colombo city and lead to negative consequences for its human population.
On a close examination of research focusing on the aforementioned issues in the CMA, it was observed that not much attention has been paid to this fast-developing Area. Further, the environmental and economic parameters have not been analyzed in relationship to LULC changes. Hence, this study focuses on economically and ecologically important 6 DS divisions in Colombo District. This paper explores the causes and effects of LULC dynamics as well as the environmental impacts of alternative urban planning, policy, and management schemes at the landscape and regional levels. The main purpose of this paper is to provide a quantitative assessment of the spatial and temporal dynamics of physical urban development in the Colombo and extended urban region. And this empirical study will attempt to identify the temporal pattern of LULC changes for Colombo using geospatial data so that both the scientific community and decisionmakers can assess the various dynamics affecting LULC changes in this urban environment.
1.1 Study area
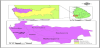
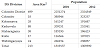
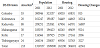
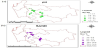
Colombo district is the economic hub of Sri Lanka and is in the Western part of the country. There are 13 Divisional Secretariat Divisions (DS Division) in a 699 Km2 area. With a population of approximately 2.3 million (2012 Department of Census and Statistics (DCS)). The selected case study area covers 6 DS Divisions (Figure 1) with an area of 213 Km2 and a population of 1.3 million (2012 DCS). Colombo DS division has a higher population density compared others. The distribution pattern of residential densities by district varies according to the pattern of urbanization in different areas. Residential density in Colombo city is around 709 per Ha in the year 2010 according to Urban Development Authority (UDA).
According to (City of Colombo Development plan - UDA) CMA’s (CMA has 3 districts namely Colombo, Gampaha and Kalutara) built up has increased from 3.3% in 1981 to 5.5% in 1996. The district distribution shows that in 1996 about 17.6% accounted for the built-up area in Colombo, 3.3% in Gampaha, and 2.2% in Kalutara. Agricultural land, both highland agriculture and paddy fields, have been significantly reduced from 1981 to 1996. For example, the coconut area example, declined from 8.9% to 7.8%, rubber from 20.2% to 18.0%, and paddy from 14.9% to 12.43%. The major issues of land use in the CMA are the incompatible uses of the lands in the CMA, ad hoc conversion and fragmentation of highland agricultural lands for urban activities, increasing demands for reclamation of marshy lands and filling of abandoned paddy fields for building construction.
2. Method and Data
2.1 Data acquisition
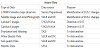
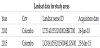
Data on LULC have extracted from Landsat 7 images for years 1990 and Landsat 8 for 2015. 1990 Survey Department 1: 50000 Colombo digitized map (Map sheet 66) were used as a base map for the evaluation of LULC changes (Table 2 & Table 3). Satellite images were obtained from Department of Survey Sri Lanka and Sri Lanka Land Reclamation and Development Corporation (SLLR & DC). Images were geo-referenced to Universal Transverse Mercator projection. Ecological, Socio-economic, and Environment data was collected from DCS, SLLR & DC, UDA and Survey Department of Sri Lanka.
2.2 Image processing
To examine the difference of LULC changes two years, 1990 and 2015, were used as reference points for this study. Most significant land use was divided into three categories: Buildup, Wetland and, other cultivation areas. Supervised maximum likelihood classification method was used to classify and evaluate images for differences between 1990 and 2015. Detail process has described following paragraphs.
2.3 GIS Analysis
GIS software (Arc GIS 10.3) was used to conduct a special analysis of environment changes in urbanized areas. LST was calculated by using Arc GIS 10.3 Raster Calculator using the following methodology: (1) LST analysis was conducted using USGS/NASA Landsat 7 Enhanced Thematic Mapper Plus (ETM+) and Landsat8 Operational Land Imager (OLI) satellite data; (2) Landsat 7 and 8 data were obtained in 30 resolution levels; (3) Bands 1-5 and 7 were acquired in 30 m resolution whilst thermal band (band 6) was acquired in 60 m resolution; (4) Band 8 (panchromatic) had a resolution of 15 m. apart from Landsat 7; (5) Band 10 and 11 of Landsat 8 were used to identify the LST distribution pattern of Colombo city using remote sensing and image processing techniques; (6) Images were geo-referenced using WGS84/UTM Zone 44 N projection system [18]. Landsat 7 & 8 Science Data Users Handbook describes the retrieval method of LST from the thermal band of an image [18]. The digital number (DN) values of the thermal bands of the 2 images were converted to spectral radiance values by using following Equation (1):
Which is also expressed as Equation (2):
Lmin is minimum spectral radiance, Lmax is maximum spectral radiance, QCALmin is the minimum quantized calibrated pixel value (corresponding to Lmin) in DN and QCALmin is the maximum quantized calibrated pixel value [9,19].
Subsequently, the calculated radiance values can be converted to effective at-satellite temperaturein Kelvin (TB) by applying the inverse of the Planck function using pre-launch calibration constants listed in table of Landsat 7 Science Data Users Handbook page 120 and page 69 of Landsat 8 and the formula as shown in Equation (3).
The calculated temperature values in Kelvin were converted to Celsius degrees by using Equation (4).
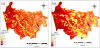
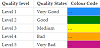
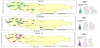
The LST of Colombo city computed using the Landsat ETM+ images classified into 6 classes as illustrated in Figure 2. The highest temperature value class was assigned with dark red colour indicates the regions where higher LSTs were accumulated; hence it can be considered as the possible UHI formations in the study area. The lowest temperature class was assigned with light yellow colour it indicated the sea and water bodies.
2.4 Surface Water Quality
Water Quality research data was obtained from SLLR & DC which collects data from forty (40) water monitoring locations across the surface drainage network system in the study area. The data from the 40 monitoring stations provide an opportunity to examine water quality and variation across the wetlands of Metropolitan Colombo [13]. The monitoring and evaluation involved a combination of in situ assessments using hand-held water quality instruments and the collection of water samples for laboratory analysis [20,21]. Data recorded using in situ field instruments included: (a) pH value; (b) Electrical conductivity; (c) Salinity; (d) Turbidity; (e) Temperature; and, (f) Dissolved oxygen. Laboratory analyses were conducted at the SGS Lanka (Pvt.) Ltd laboratory using standard analytical techniques [13].
2.5 Soil Quality
According to wetland management strategy technical manual 5, Soil investigations were undertaken through the application of a rapid field assessment technique using a hand-held auger (auguring to a maximum depth of 1m). The stratified sampling approach adopted highlights differences in elevation/topography and or vegetation and investigates these boundaries and the relatively homogeneous areas they delimit so that the soils can be related to the landform and vegetation type.
Some of the wetland areas were not accessible for a number of reasons. Nevertheless, the study covered representative wetland areas, marshy lands and paddy land areas. Investigations did not cover areas where the soils were clearly heavily disturbed or in-filled. Two hundred (200) soil samples were collected from wetlands, paddy land and other marshy lands to evaluate the following soil parameters: (1) pH value; (2) percentage (%) of moisture; (3) Electrical conductivity; and, (4) Sand content. All these 200 sample locations were handaugured using standard depth values for the soil analysis (MCUDP Technical report 5).
2.6 Statistical Analyses
In this study, the relationship between LULC, surface water quality and soil characteristic were tested using statistical software (SPSS). The coefficient of determination (R2) was extracted for land use change percentage against surface water quality and soil characteristics.
2.7 Methodology
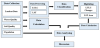
Environmental impacts and LULC changes in the study area were assessed based on remote sensing data and spatial analyses from GIS. Figure 3 illustrates the overall research approach and following section will explain methods regarding application model.
3. Result
3.1 Land Use and Land Cover Changes
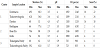
The study area comprises six DS divisions as shown in figure 1. The area has spread out, a wide range of residential areas containing high and low-density houses scattered along main transport corridors and significant landmarks and table 2 represent available land covers in the year 1990 and 2015 (Figure 4).
Table 4 shows buildup has increased 14 % from the total land between 1990 and 2015. Cultivation decreased by 10 % from total land use. Most importantly, more than 7 % of wetland has disappeared. By investigating satellite images, it was observed that the 7% wetlands were transformed to non-reversible land use type. Both sceptics and optimists agree that the majority of wetlands in human-dominated landscapes continue to be threatened regardless of their protection status [22,23].
To support above argument, the content of table 5 clearly indicates the changes in a number of housing from 2001 to 2012. With the market economic reforms, urban wetlands degradation and loss were intensified considerably with urbanization and the exponential growth of the real estate markets since the mid-1980s [24].
3.2 Surface Temperature
With the rapid urbanization, hard land cover has rapidly increased, especially the man made concrete structure and man made environmental inputs, soft land cover areas have been reduced over time affecting its bioclimatic conditions. As an example, the average air temperature of Colombo city for the last 100 years (1901-2001) has remained around 27 0C with more positive deviations in the conditions in the recent past and very significant trend of increase in the future [25].
The temperature of the land surface temperature in the study area (Figure 1) showed a distinct expansion in the high surface temperature zone starting in 2010. Figure 2 (a) shows a (with a dark red colour area) expansion in land temperature that has spread from the DS Division Colombo and Thimbirigasyaya to the east side of the study area, covering Kotte and Kolonnawa DS divisions. (There are some significant low heat zone (yellow) can be observed in (b) due to cloud conditions, a moment of capturing the image).
3.3 Surface Water Characteristics
Based on this collected dataset and using only the first campaign to assess water quality on the top water layer (water sampling location), It can be summarized as follows, based on table 7 and 8.
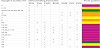
- 50% of the water area was level 5 category
- 15% of the water area was level 4 category
- 15% of the water area was Level 3 category
- 20% of the water area was Level 2 category
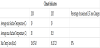
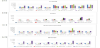
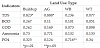
Ammonia, phosphorus and total dissolved solids (TDS) are the main problematic parameters particularly in the study area (table 7). And base on above data (Table 8) TDS, COD and NH 4 distribution around surface water bodies are shown in figure 5.
Following figures (Figure 6) demonstrated data of 4 historical surface water quality sample stations related to COD, DO and BOD and Ammonia content selected from 30 historical sample stations within the study area and time spectrum runs from 2006 to 2014.
According to figure 6 historical data, following observation can be made:
- Deterioration of BOD since 2010
- Deterioration of COD since 2010
- Ammonia partially deterioration since 2011
- Deterioration of DO since 2011
3.4 Soil Characteristic
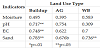
Table 9 soil analysis of sample locations within the study area as described in above paragraphs. Based on data in table 9, Figure 7 represents the variation of pH value and sand percentage over main marshy in the study area.
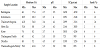
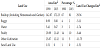
Standard deviation value of the minimum moisture percentage values was 11.23% and most of the data were found in the 47-70% range. Standard deviation value of the maximum moisture percentage values was 13.33% and most of the data were found within the 54-81% range. Standard deviation value of the all moisture percentage values was 12.69% and most of the data were found within the 50-76% range. Overall, the distribution of moisture value difference between the lower and upper-temperature findings was not significant. According to the spatial distribution of moisture values, as shown in table 9, no soil areas within the 80-100% moisture range content were identified (SLLR & DC Technical report 5).
As depicted in Table 9 spatial data related to soil pH levels, the results show that, except for 2 sample locations, all sample locations showed a very high acidity level. According to the United States Department of Agriculture, Natural Resources Conservation Service pH standards, 75% soil sample locations presented a strong acidic range and 25% were in moderate acidic range (USDA).
3.5 Impact of LULC on the environment
This paper mainly focuses on wetland cover changes and its impact on the environment so wetlands and the benefits they provide are fundamental to maintaining human well-being within urban environments [26]. Colombo wetland acts as main flood water storage during flood season and it absorbs 39% of flood water. The degrade of wetland area would severely effect to social well-being. Despite the progressive impacts and threats from urbanisation, the wetlands within the CMR continue to support a rich biodiversity including species of global conservation importance. In such condition changes of land cover, changes of soil and water characteristics and an increase of surface temperature would cause impact to the natural ecosystem as well as human society.
Further, following facts base on statistical analysis gives statistical representation on land use changes, surface water quality and soil characteristics. Table 11 represents the coefficient of determination between land use changes percentage and water quality parameters based on table 8.The result indicated that some of the water quality indicators were significantly correlated with land use changes (TDS, Ammonia, PO4).
The correlation among land use changes and soil characteristics showed there was a significant correlation between those two variables (Table 12). The soil characteristic indicators, land used type in the study displayed strong correlations with each other.
4. Discussion
LULC changes are the major issues and challenges for the ecofriendly and sustainable development for the economic growth of any area [27]. Population growth and expansion, undoubtedly, is strongly related to deforestation, soil erosion, which, in turn, is associated with global warming, negatively affecting the overall quality of the environment [28]. Environmental impact assessment in study area mainly focused on the unplanned, haphazard urbanization in the region, particularly in the urban sprawl, circular development around Colombo city.
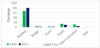
The significant changes of LULC in study area must be taken into account given the magnitude of the 11% loss of agricultural land and 7% of wetland in a relatively short period of time of fewer than 10 years (Figure 8). These LULC changes took the form of hard surface cover, mainly consisting of residential and industrial use and related transportation infrastructure. Besides the emphasis on the loss or transformation to hard surface land use, it is important to point out the associated environmental factors that go along with these LULC changes, temperature increase, water quality and soil deterioration.
Though national wetland policies gained impetus in the late 1990s, the practical implementation has been slow and has, in effect, not been fully implemented [23]. Loopholes in the wetland policies and lack of human resources to supervise its practice are related to the resulting urban sprawl and loss of the wetlands and agricultural land in such a short span of time.
Ensuring the stability and normal functioning of the ecosystem requires the development, implementation, and continuous improvement of the techniques and criteria of evaluating water quality for different types of water management. It must be emphasized that the results (Table 7) of the surface water quality assessment shows that most areas surveyed were not in the good quality category. Of even more important is that there is a trend shown in the historical data from 2006 to 2014 that shows that level of water quality has been getting worse since 2010. One of the main factors responsible for the reduced surface water quality is related to increased domestic waste water. For example, Turbidity, BOD, COD have sharply deteriorated since 2010, with ammonia having slightly increased deterioration since 2011 and Phosphate high deterioration in 2014.
Human intervention is significantly associated with the results in Table 9 and Table 10 that show soil quality in the area studied. The results may be classified into cluster groups as shown in table 10. Cluster group 1 has similar physical soil characteristics, moisture percentage within 42-60 and, pH values between 3.5 to 4.7, electrical conductivity 1000 to 1300 (μs/cm) and sand percentage 5 to 25. This wetland land cluster has a less moisture percentage high acid level and high sand percentage compare to another cluster in this group it shows that it has comparatively significant human interventions. Cluster group 2 of table 10 showed that pH values were loweredan electrical conductivity higher than other categories examined. Most importantly, previous satellite images of this area showed a clearly visible significant human intervention activity in the area, e.g., unauthorized human settlements, encroachments and constructions in this cluster area. Cluster 3 of table 10 has different physical characteristics than the other two clusters, pH values were higher (5-6) and electrical conductivity lower (700-900), values associated with agricultural land use and less human presence.
In terms of Temperature changes, a striking significant result is the increase of 30% of area associated with increase in temperature which extended from 19.63 Km2 to 36.11 Km2 within a five years span (figure 5), though not a significant difference in average minimum in land surface temperature in study area varied in the years of study and only a slightly higher difference in the maximum average temperature than the year 2010 (Table 8). The changes of Maximum temperature zone happened because of LULC changes of available land cover within the area. Because the removal of vegetation and elevated LST may have adverse effects on the surrounding environment, it is necessary to examine the effects of each factor individually and their synergistic effect on the surrounding areas. The results clearly show that land cover changes may alter LST.
Overall, the results from this study show that human intervention in the form of LULC clearly and adversely affect the three environmental factors examined: surface water and soil quality decrease, and maximum average temperature of LST changes extends to larger hard surface areas.
As stated above, this environmental deterioration in a relatively short time, with the loss of many green space and wetland areas including paddy land has policy implications for the future urban development of Sri Lanka. If left unattended and unplanned and unsupervised LULC can continue, such rapid urban environmental change may very well lead to significant urban environmental problems in the future. The high percentage loss of cultivation land within study area has implications for food production, environmental sustainability, ecosystem stability and social benefits.
In summary, LULC changes because of a human intervention clearly lead to negative changes in environmental indicators. Conversely, the absence of human intervention or LULC changes is associated with lesser measurable changes in the study’s environmental indicators: water and soil quality, and land surface temperature changes.
5. Conclusion
In general, wetlands in urbanized areas are likely to have higher levels of oxygen demand, nutrients, suspended solids etc. The negative impacts of urban land use on wetland including paddy land are a key concern for stream restoration, stream management, land planning, and land management. To establish effective water and soil quality management policies, it is essential to understand the true nature of the relationship between water and soil characteristics and urban land use. Based on statistical findings and ground survey the changes of urban land use had a significant impact on the degradation of stream water quality and soil characteristics in the study area. The increase of maximum LST was due to degradation of water bodies, vegetation and increase of buildup area, this continues the non-reversible transformation of wetland into buildup will make the situation more conducive and it is high time to address the situation without further waiting for a solution. Further degradation of water and soil characteristics and an increase of LST would badly cause to natural ecosystem and degradation of soil characteristics greatly affect paddy cultivation.
Sri Lanka is a developing country with urban policy structures that lack the human and financial infrastructure for a full implementation, e.g., lack of expertise, multi-disciplinary environmental assessments and scientific support in the decision-making process. It is necessary to have quantitative data to evaluate the causes and effects of urban LULC dynamics. For example, the use of spatial patterns may reveal the environmental impacts of various urban planning, policy, and management schemes at the landscape and regional levels. If landscape changes continue at the rapid rate that has been taken place since 2010, there may be serious environmental negative changes in the future. Therefore, analytical tools and indicators need to be developed that can project future trends and monitor ecological, physical and social changes in Sri Lanka.
Additional implications for policy making and urban planning include the need to manage water and surrounding environmental conditions through local and regional planning by optimization and maximum use of available land covers, including the removal of pollution sources from water-ways, maintaining green space along rivers and lake corridors, and building up necessary sewage system and sewage treatment facilities, in particular in the slum area.
There should be control mechanisms for land reclamation and prevention of wetland encroachment. Also, policy-makers need to explore solutions for the prevention of haphazard, unauthorized development of housing units, and regulation of real estate market in Colombo suburb for future, sustainable development.
Results of this study can lead to constructive ideas and insights to urban planners, researchers, and managers for linking remote sensing data with policy, management schemes, and environmental characteristics. Further research applying finer indicators of environmental impact and landscape effects could expand on our results and these may better clarify the complex nature of the relationships between LULC changes and the environmental. It is projected that environmental changes will occur if LULC changes continue, yet a monitoring system is highly recommended to corroborate this association and to alert to negative trends. This proposed monitoring system should use analytical tools and include biological, physical and social indicators that can alert to negative trends prior to greater negative impacts. Monitoring data may be integrated into evaluations of mid and long-term future strategies for a sustainable future.
Competing Interests
The authors declare that they have no competing interests.