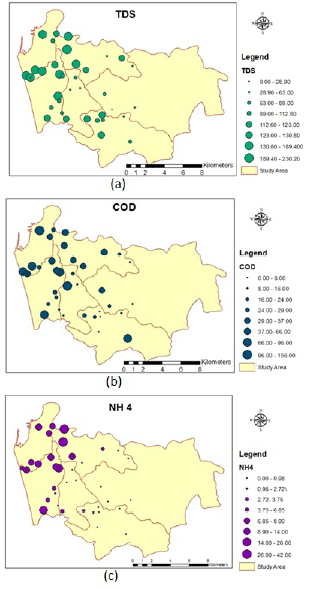
Figure 5:
Distribution of (a) TDS (b) COD (c) NH
4
in study area.