


1. Introduction
The cities all over the world are growing. According to the projections of the UN in 2014, the amount of people who live in cities will grow up to 66 % in 2050 [1]. To provide housing for the future occupants, green areas will be reduced in the city and be replaced by buildings. This affects the life quality of urban inhabitants in a negative way. To set plants there is less area on the ground of the cities. A chance could be to set plants on buildings. Therefore the facades of the building could be used.
Additional to optical affects, the plants also influence the microclimate that surrounds them. They cool their surroundings on hot days, regulate the relative humidity, bind dust, reduce noise and provide habitat for animals [2-9].
Many product manufacturers of façade greening systems affirm that their systems also reduce the heating requirements of the building. So far there is no general proof for that. The published information is based on simulations. Usually only a few of several components which effect the thermal resistance of the façade are measured and the others are estimated. In [10] the gain of the thermal insulation was estimated based on the wind speed in the ventilation gap. Because of the measurements the authors of [10] found out, that the wind speed behind the green system was lower than 0.2 m/s. This is a wind speed which is usually at interior constructions. Considering this fact at the exterior surface resistance was equalized with the interior surface resistance. For the interior and the exterior surface resistance there exists a standardization which is explained in EN ISO 6946 [11]. Based on this standardization the interior surface resistance is higher than the outdoor surface resistance value by 0.09 m2.K.W-1. The result of the authors of [10] is the improvement of the thermal resistance value because of the greening by 0.09 m2.K.W-1. In [12] the total thermal resistance value of a green wall, is estimated to be 0.52 m2.K.W-1 when the whole system (not only the reduction of the wind speed) is taken into account. This means that a façade is insulated better by the resistance of 0.52 m2.K.W-1 when it gets greened. In other words, this publication suggests that the thermal resistance is increased by 0.52 m2.K.W-1 through an applied facade greening. Note that this estimation integrates the overall improvement, not alone the improvement based on wind speed consideration.
In [13] several simulations were performed to investigate the effect of green facades on heat resistance value. Different simulation programs were used for that. The result of the performed showed, that the heat resistance value can be increased by 23.7 % by façade greening. As the paper [14] shows, the relative reduction of the energy demand caused by green roofs depends on the building itself. A wellinsulated roof shows a lower reduction of the heat demand. The same is true for facades.
In [15] the green wall was simulated with the UFORE simulation program [20]. This program could not give an output of the total reduction of the heat demand because of façade greening. But it was possible to find out, that the wind speed behind the greening is reduced. This reduces the heat demand.
Mahmudul Hasan showed in his master thesis [16] that green facades show a resistance value by 6.16 m2.K.W-1. This is the sum of the heat resistances from the materials of a living wall system. The façade of the building and air gap behind the living wall are not considered. But the effect of the air gap, which is in contact with the exterior air, reduces the heat resistances dramatically. This is why the heat resistance value is that high in this thesis. The thesis also investigates the temperatures in the ventilation gap but focuses on summer temperatures and the cooling effect of green walls. The heat resistance value is not calculated in detail.
Green roofs are better known than green facades. In [17] five different green roof systems were investigated on a test cell in Greece. The dimensions of the cell are 8.4 m × 3.8 m × 3.6 m. On the top of the cell different roof greening systems were installed with the size of 0.6 m × 1.2 m. The heat flux was measured and simulations were performed. According to that simulations the energy savings for heating because of a green roof are 21.1 % - 28.4 % in comparison with a non-insulated roof.
This contribution investigates the effects of façade greening systems on the heat flux through the facade in the winter (during the heating period). Also temperatures were measured on two different points of each façade (one part is greened, one is not greened) to calculate the heat resistance values (details see in chapter 2). The heat flux of the façade was measured on two different parts of the façade, one part was greened, the other one not. So it was possible to compare the greened part of the facade with the not greened part. Two different locations and two different greening systems were investigated. The two locations are in Vienna in urban surroundings. In this area the heating degree is 2768 Kd within one year [18].
This contribution is a demonstration of the first u-value in situ measurement that was taken on greened facades [19]. The results which are shown in this paper are calculated with simple formulas, based on the measurement and not simulated.
2. Matherials and Mehtode
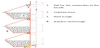
The investigated greening systems were applied via curtain-wall technologies (including an air space). This is shown in Figure 1, Figure 2 and Figure 3. They are installed on rails, which are fixed on the façade of the building. The vegetation on the walls are herbs and grasses.
The two locations which were investigated are:
- Office building of the Municipal Department 48 (MA 48)
- School Kandlgasse 39 (GRG 7)
The detailed features of the green facades and the measurement setup are described below.
Within the following two paragraphs the investigated walls are introduced.
3. Office building of the Municipal Department MA 48
The greening system installed on the facade of the MA48 building is based on aluminum troughs. This system will be referred to as "System A" from now on. The troughs are connected with each other, thereby forming a curtain façade (see Figure 1). The distance from the house façade is determined by the thickness of the metal rails. In this case it is 6 cm. The building is situated in urban surrounding. The measuring points of the façade are faced to south and to a big street with several lanes. This causes that the location is exposed to sun and wind.
4. School Kandlgasse 39 (GRG 7)
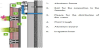
This location is a grammar school. The greening system is a different system (here it is called System B) than the system that is referred to see above in (Figure 1). The plants grow horizontal out of aluminum modules. The roots of the plants are in direct contact with a capillary fleece, which distributes the water evenly. The substrate is inside the modules. They are mounted on metal rails, which are the connection to the façade (see Figure 2). The measuring points of the façade are faced to south into an inner court yard. This causes that System B is less exposed to wind. But as it is faced to south it is also exposed to the sun.
5. Monitoring Equipment
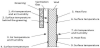
The effect of greened façades on the heat flux depends on the construction of the house. The impact of the improvement by greening systems can be considered to be more significant if applied on walls that show a high thermal transmittance in their original state. Because of that, the whole construction need to be investigated. One difference to the method that was used in [5] is, that here the surface resistances themselves were measured. This demands the measurement of air temperatures, heat flux and surface temperatures as shown in (Figure 3). The heat flux, the air temperature (outdoor and indoor) and the surface temperature on the façade interior and exterior was measured to get the needed information of the thermal insulation of the façade. It was measured at the same building, on the same façade on different parts (one part that is plain and the other one is greened).
The sensors that were used for the measurements are described within the following lines.
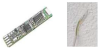
The Lin Picco A05 [21] is used to measure the air temperature and the air humidity. A picture of that sensor is shown in (Figure 4) left. The temperature of the surface of the façade was measured by PT 1000 shown in (Figure 4) right. The accuracy of this sensor is 0.1 K. It is glued on the façade and painted by façade color.
The Lin Picco sensor has a protection cover made out of plastic. It is shown in Figure 5 left.
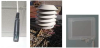
This plastic cover is the protection for the sensor. Exterior the Lin Picco A05 is also protected by a protective shield (shown in Figure 5 middle).
The heat flux measurement was carried out by a heat flux film which was fixed with adhesive tape on the wall. The adhesive tape closes the border of the heat flux film airtight. The heat flux film is measures the power of heat that leaves the room into the wall. The specific power is displayed by W.m-2. The accuracy of this device is 5 %.
5.1 Following filters where used to find the valid data:
- Only the measurement period during the heating season was taken into account. The reason for that is, that u-values can be measured with a higher accuracy during high temperature differences between indoor and outdoor.
- Because of the storage mass of the façade the valid data need to have a high temperature difference in average between the air temperature outdoor and indoor, within the last 24 hours, the last 48 hours and the last 72 hours. This temperature was chosen to be above 10°C. There was also no moment within the last 24 hours, when the temperature difference decreased below 0°C (this happens very rarely during this measuring period, when the temperature outside is higher than inside).
- The measured heat flux was filtered to be above 0 W.m-2. The heat flux is measured on the surface of the construction and reacts very fast on air temperature conditions inside. When for example a window near the measuring station is opened, the heat flux decreases very fast. Even in winter it might happened that it decreases below 0 W.m-2 (because the construction temperature is above the air temperature inside). This data lead to wrong analyses. Because of this reason they were filtered out of the data pool.
- Also the temperature fluctuation around the investigated façade should be very low within the last 24 hours. This way the conditions are more stationary. The difference between the air indoor and outdoor and the surfaces of the façade interior and exterior were below 2°C within the last 24 hours. This means that an increase of the indoor temperature of 3°C would only be taken into account, when the outdoor temperature also increases at least by 1°C. This way the interior and exterior temperature difference of the façade stays below 2°C. Otherwise the data is not considered because of too high fluctuation. This causes almost stationary conditions, comparable with the conditions in a laboratory.
- MA48 – System A: The shown data are the average of 395 different measuring cycles.
- GRG7 – System B: The shown data are the average of 1.389 different measuring cycles
6. Results and Discussion
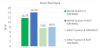
In this chapter the measuring data are shown. The heat flux (Figure 6) illustrates the transmission losses through the façade. Given that the indoor temperatures can be considered as identical, the relationship between the heat flux values can be understood as the performance difference between greened and non-greened wall parts. In the building MA48 both parts of the façade (greened and not greened) are measured in the same room. In GRG7 two different rooms are necessary to measure both conditions (greened and not greened).
To consider the different temperatures in the room, or parts of the rooms and to get absolute values to compare between the greened and not greened parts of the facades, the resistances of the heat conductivity are calculated (formulas shown in Eq. 1, and Eq. 2). One of the resistances is defined by [11]. It is RSI = 0.13 m2.K.W-1.
Eq. 1 shows the way the resistances of the facades were calculated, by the measured data. The interior surface resistance is not changed because of the greening. The same is true for the resistance of the facade, but as the wall might be different (because in GRG7 two different floors are investigated). Eq. 2 shows the formulas to calculate the exterior surface resistances by the measured data. In [11] this value is definite with RSE = 0.04 m2.K.W-1. But our measurements showed that the RSE is much higher than in the definition of [11]. It is about 0.11 m2.K.W-1 at the MA48 and about 0.40 m2.K.W-1 at GRG7. The reason for that is, that both locations are urban and in a wind shadow zone. In [11] a wind speed of 4 m/s is assumed for the calculation. In GRG7 the RSE is higher because the façade is in an inner court yard. At MA48 the façade is faced to an open street with a wide free area.
Units
q = Heat flux = W.m-2
Rwall + RSE + RSI = m2.K.W-1
U-value = W.m-2.K-1
Δtwall = delta surface temperature (interior – exterior) = °C
ΔtSE = delta of air temperature (exterior) and surface temperature
exterior = °C
Rwall = Δtwall . q-1
6.1 The way to calculate the heat resistance value of the wall
RSE = ΔtSE . q-1
6.2 The exterior surface resistance value
The additional heat resistance of the greening system is considered in the RSE. The exterior air temperature is much lower than the temperature of the façade behind the greening system, because the greening system protects the façade and composes a buffer that is wormer than the exterior temperature. This causes a higher surface temperature of the façade behind the greening system. The average surface temperature of the blade façade in GRG7 is 2.80°C. Behind the greening system is 3.33°C even though the greening system shadows the sensor. In MA48 the surface temperature of the blade façade is 4.75°C in average and behind the greening the average surface temperature of the face is 8.27°C. The average temperatures at MA48 are higher because the measuring points are closer to the ground. They are at the level of the ground floor. In GRG7 they are at the level of the 3rd floor.
The sum of the heat resistances (see Eq. 3) are the total heat resistance. Its inverse is the heat transfer coefficient U-value, see Eq. 4.
Rtot = Rwall + RSI + RSE
6.3 The formula to calculate the total heat resistance of the whole construction
U-value = heat transfer coefficient = 1.Rtot-1
6.4 The formula to calculate the heat transfer coefficient (U-value)
The outputs of Eq. 4 are shown in Figure 7
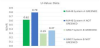
The results show that there is a difference of the greened and the not greened part of the façade. System A increases the thermal resistance by 0.31 m2.K.W-1. System B raises the thermal resistance by 0.67 m2.K.W-1.
7. Conclusion
This paper shows the increase of the heat resistance value (or the reduction of the U-value) because of façade greening. In the case of the investigated constructions the gain of thermal insulation is about 20 %. But this gain depends very highly on the construction of the façade itself. If there would be an insulation with XPS, the greening system might cause thermal bridges. It is obvious that the size of the ventilation gap is important for the results.
8. Discussion
In situ measurements of the U-value are not very accurate. Its results depend on different parameters. These parameters are for example the storage mass of the construction, the fluctuation of the temperature and the user behavior (the buildings are occupied and used) as ventilation, opened room doors or waste heat of computing and human. The way the data are filtered for the analysis in this paper is unique. There is no long year research to confirm that the methodic is without any mistake.
Beside that only 1 dimensional heat flow is considered.
Within the next steps the ventilation gap (size of the opening holes, distance between facades and greening construction) will be investigated more. The effect of the size of the opening hole and wideness of the gap on the U-value will be researched.
Investigations of the thermal bridges because of fasteners.
Simulations of the air streaming in the ventilation gap with computer programs.
Competing Interests
The authors declare that they have no competing interests.