


1. Introduction
The oldest of all geophysical investigations began with the magnetic mapping as this technique is simple, efficient, and economical besides being reliable. It is widely used technique for locating both hidden ores and structures associated with mineral deposits as well as oil and gas [1,2]. Magnetic method is quite popular and are being used in the exploration [3,4] to delineate subsurface structures such as faults, anticlines, synclines etc. [5,6].
Normally the acquired magnetic data in any geophysical survey is the sum of magnetic fields produced by all underground sources. The subsurface targets of specific surveys are often small scale structures buried at shallow depths. The magnetic responses of these targets are embedded in a regional field that arises from magnetic sources that are usually larger or deeper than the targets or are located farther away. Fairly correct estimation and removal of the regional field from the initial field observations yields the residual field produced by the subsurface target. It may be noted that the qualitative interpretation of magnetic anomalies has to do something on studying the given magnetic map, profile or digital data to have a picture of the probable subsurface causes separating the effect of individual features on the basis of available geophysical and geological data and estimating the likely parameters of the bodies of interest from the corresponding residual [7]. Ramesh Babu et al. [8] have successfully applied magnetic method in association with VLF-EM technique in delineating uranium deposit in Proterozoic basins of Raigarh ore, India.
On the other hand, the quantitative interpretation is meant to compliment the qualitative method and provide useful estimates of the geometry, depth and magnetization of the magnetic sources [9,10]. Regional magnetic maps reflect the deeper part of data carrying less about shallower parts [11,12], while the residual ground magnetic map gives moderately low magnetic values which is an indicative of shallow subsurface geologic structures [13]. Yet another means of interpreting the magnetic anomalies is the Euler deconvolution of the total magnetic field and its spatial derivatives. Euler deconvolution has emerged as a powerful technique for automatically estimating the depth and the geometry of the buried magnetic sources [14,15]. This technique has become popular because no need of an apriori information about the source magnetization and special geological model as required for profiles [14] and gridded data [15].
The spectral analysis has the ability to filter out the noise from the data sans any loss of information during the process, and in general, operations are easier to perform in frequency domain [16]. Spectral analysis of magnetic anomalies ensures source parameters such as depth, dip, width etc in addition to basement depth [17]. Relatively a recent method developed by Salem et al. [18] for the interpretation of gridded magnetic data based on derivatives of the tilt angle, provides a simple linear equation, similar to the 3D Euler equation. This method estimates both the horizontal location and the depth of magnetic bodies, in the absence of any knowledge of about the nature of the sources structural index. However, using source-position estimates, the nature of the source can then be inferred. The method ensures an adequate accuracy because it utilizes second order derivatives of the magnetic anomaly and is sensitive to the presence of noise in the acquired data [19].
The amplitude of the analytical signal or energy envelope [20] of magnetic anomalies is an important property which is independent of the direction of magnetization of the source [21]. A major advantage of using the analytic signal is to identify magnetic anomalies independent of remanence [22]. In specific, the amplitude of analytical signal is used in potential field data for precise spatial location of subsurface targets [23].
In this study, prior to magnetic survey, gamma ray spectroscopic measurements were made randomly as well as a grid along the traverses. Additionally, a G-859 mining magnetometer (Geomtrics) was used to investigate subsurface structure speculated as a mineralized hidden fault. Accordingly, as many as eleven profiles in varying length (due to hazardous terrain) along which measurements were made at an interval of 10 m in Dhofar region, close to Yemen border of Sultanate of Oman. After applying preliminary corrections, the regional map to illustrate deep anomalies and also the residual map to study near surface targets were obtained. The ED of the tilt derivative map has provided the depth to source location of the subsurface features. Finally power spectrum of the magnetic field data has been derived for a half space source and the structures that are deciphered to be lineaments. It may be interesting to note that all these quantitative methods of interpretation resulted the source parameters in close agreement to each other and the results are presented here.
2. Uranium Occurrence
The major types of Uranium deposits are grouped according to their respective geological setting however not in order of their economic potential [24-27]. Unconformity-related deposits occur in the immediate vicinity of major unconformities separating igneous basement and overlying clastic sediments. Metasediments near the boundary are usually faulted and brecciated and are the locus of the main mineralization. Igneous environments (intrusive and extrusive) not only include intrusive rocks per se, but vein deposits (graniterelated; fillings of voids, such as cracks, veins, fissures, pore spaces, breccias, and stock works), pegmatites containing rare metals (Sn, Ta, Nb, Li, and REEs), volcanic and caldera-related deposits (forming veins or disseminations in acid to intermediate rocks related to faults and shear zones) and hematite breccia complex deposits (associated with a near surface explosive events involving boiling processes).
In metamorphic deposits, the uranium enrichment can directly derive and concentrate from the metamorphosed rock, while metasomatic processes (e.g., Na metasomatism) lead to a redistribution of uranium via leaching, transport, and mineralisation in the form of disseminations within structurally deformed rocks (Precambrian shields). With the exception of phosphorites (marine and of continental-shelf origin), sedimentary uranium deposits show the significance of carbon (coal and hydrocarbons; producing a reducing environment) in capturing uranium by adsorbing it on lignite (coal), organic matter in black shales (also carbonaceous pyritic shales), sandstone deposits. While the geological environment of some Archaean to early Palaeoproterozoic quartz pebble conglomerate deposits with detrital uraninite could also be classified as metamorphic environments, they also clearly indicate reducing conditions (anoxic atmosphere, prevalence of hydrocarbons at least during overprinting) in addition, hydrocarbons occasionally also enrich uranium.
Two-thirds of the world's production of uranium comes from Kazakhstan, Canada and Australia which mostly comes from Proterozoic rocks [28]. The Athabasca basin (Canada) accounts for 30% of high grade uranium production in the world [29]. The surface of the basin consists of main sandstone sediment varying from 100 to 1000 meters in depth. The uranium ore is mostly found at the base of this sandstone, at the point where it meets the basement [29]. In Australia, Queensland is the largest producer of uranium (as yellowcake) [30]. Kazakhstan has been an important source of uranium for more than 50 years [31]. New investigation to evaluate uranium contents occurring in India , Uzbekistan and many countries around the world. Jordan is the only country in the Middle East that has a confirmed source of Uranium [32].
The history of uranium exploration began during early 1980s in Sultanate of Oman, wherein [33-35] a number of target areas have been identified. Subsequently, a couple of sites were selected on the basis of prevailing radiation which prompted further investigation based on geophysical and geochemical methods. Accordingly, the Gamma ray spectroscopic investigation was carried out to trace the uranium concentration. Subsequently, a detailed study based on VLFEM technique has been carried out. According to Forbes et al. [36], in southwestern of Oman (some 300 km west of the site), there are indications of high radiation in oil well logs which intersecting the shales of the Andhur formation. The carbon content of these shales could have acted as a pre-concentrating medium for uranium while faults intersecting such formations acted as pathways for migrating fluids [36].
3. Geology of the Study Area
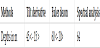
The study area covers an area of 0.35 sq.km (Dhofar region) encompasses the coordinates of latitudes 16.8847018N to 16.89321N and longitudes 53.4178125E to 53.4229073 E (Figure 1(a)). In this study, we focus on relatively young sub-horizontal layers of Tertiary micritic (EOzl) and lacustrine (Oaq) limestones including calcretes (surficial deposits) that are cross-cut by mineralised fault systems (veins). Geological map and vertical profile (the green arrow indicates the approximate position of the investigated site; the yellow line on the map corresponds to the location of the profile) in Figure 1(c), modified after the geological map of Oman, west of Salalah.
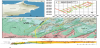
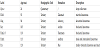
The area is heavily faulted (striking NE-SW, Figure 1(c)) and some of these faults have already been identified as the place of uranium enrichment. Since many of the limestone samples of the area have uranium levels below the detection limit of our equipment (portable XRF: < 1 ppm), we can rule out a general unfocussed uranium enrichment of the rocks. Rather, the fault systems must have acted as fluid conduits for circulating waters scooping up uranium from deeper formations and carrying it to higher levels along the fault plane and also distributing it near the surface. Possible sources for the observed uranium anomalies are: crystalline Proterozoic basement of the Arabian-Nubian Shield outcropping west of Salalah [37] igneous continental basement and carbonaceous shales, which appear in the underlying Andhur formation (Edm1; Figure 1(c) and Table 1) occur much higher up in the section.
4. Data Acquisition and Interpretation
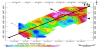
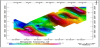
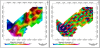
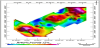
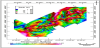
A gamma ray spectrometer BGO Super RS-230 was used to acquire random sampling in addition to measurements along the traverses in order to record the uranium concentration in the area of study and is shown in the form of contour image (Figure 2). Further, a G-859 mining magnetometer (Geomtrics) which is a high sensitive and rapid coverage device was employed to record the total magnetic field along eleven traverses of 20m apart at a measurement interval of 10 m (Figure 1(b)). Followed by preliminary corrections, the contour map of the total magnetic intensity was prepared and shown in Figure 3. The corrected total intensity magnetic field was subjected to regionalresidual separation and the resulted regional (Figure 4a) and residual (Figure 4b) magnetic contour images are shown to clarify more details. Further, the amplitude of the analytical signal of the residual magnetic data was computed and shown in Figure 5. It may be noted here that the analytical signal aids in precise spatial location of the subsurface sources where it attains its maximum. The tilt derivative map has also been generated for fair estimation of depth as well as to ensure the nature of the subsurface source (Figure 6).
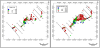
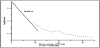
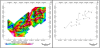
Source location as well as depth from magnetic data can fairly be estimated by the well known method of Euler deconvolution (ED) which has been computed and shown in Figure 7(a), assuming the structural index to be 0.5 corresponding to a contact. On the other hand, a structural index of 1 corresponding to a dyke resembles as shown in Figure 7(b). It may be mentioned here that the main difficulty in the method of (ED) is the choice of the correct structural index (SI) which plays a critical role for a meaningful estimation of the depth.Finally, the depth was estimated based on the well known Fourier spectral analysis of total magnetic intensity and shown in Figure 8. The manually derived lineaments from the tilt magnetic map are shown in Figure 9(a) and the location map with lineaments is shown in Figure 9(b).
5. Results and Discussion
Raw magnetic data in Figure 3 shows high magnetic values along traverses L0, L5 and L10 indicating elevated level of mineralization. The regional (long wavelength deep seated features) magnetic map (Figure 4(a)) in this area probably reflects the structure of the crystalline Proterozoic basement of the Arabian-Nubian Shield outcropping without significant contamination from shallower sources. In traverse L0, the pink area reflects deeper sources whereas red spots along traverses L4 to L10represent relatively shallower sources. The residual ground magnetic map of the study area (short wave length to depict shallow features) yields moderately low magnetic values as shown in Figure 4(b) corresponding to sources at shallow depth. Traverses L7 to L10 show magnetic anomaly with an elevated level in addition to negative anomaly which has been recorded along traverses L0 to L2. The amplitude of the analytical signal is shown in Figure 5 which aids in the precise spatial location of possible sources besides delineating boundaries of geologic structures along traverses L0 to L3, L4 to L7 and L8 to L10 respectively. The depth estimated by the method of ED from tilt derivative map (Figure 6) indicates the depth to the sources at different depths varying from less than 15 m to greater than 45 m along different traverses. Similarly, the Euler deconvolution (ED) for the structural indices of 0.5 and 1.0 corresponding to contact and dyke respectively results depths in the range < 15 m - > 45 m and <20 m - > 60 m. However, the radial spectrum yields a depth around 64 m which fairly agrees with the depth obtained from ED. The depths obtained from various interpretative tools are compared and shown in Table 2. Computed tilt derivative of the structural map and the manually derived lineaments are possibly mineralized ones and are shown in Figure 9(a) and Figure 9(b), respectively.
6. Conclusions
Reported gamma ray spectroscopic recordings although indicates a moderate radioactivity in the study area, it may highly likely that the radioactive mineralization is deeply seated. It is apparent that the structures favorable in this case are the subsurface fault/ lineaments as deep as 60m may substantiate the possible mineralization. From the total regional and residual magnetic maps, anomalous structures may strongly be realized along traverses L0 to L3 and L7 to L10. Further, the mineralized structures/lineaments possibly be as deep as less than 15 m to greater than 60 m as evidenced by different interpretation tools like title derivative, Euler deconvolution and spectral analysis substantiated by their precise location from amplitude of analytical signal.
Competing Interests
The authors declare that they have no competing interests.
Acknowledgments
The authors wish to record their sincere thanks to Sultan Qabbos University for the strategic grants provided to support this investigation.