


1. Introduction
The north Marche-Romagna area is located on the Adriatic side of central Italy. Almost all drainage basins of this area have the characteristic of displaying strong asymmetries.
For some author these asymmetries are related to the intensity of erosive processes and they can be attributed to greater erosion on the left or right sides by SE-oriented rivers. In particular, they claim this contrasts with symmetry that exists if a river has a NW-orientation, as there is greater drying out of terrain and reduced vegetative cover [1]. For some other authors the asymmetries are related to other factors such as tectonic or neo-tectonic [2]. This phenomenon is particularly evident in the Ventena river (Figure 1) where the upper, central and lower parts of the basin display strong asymmetries.
One of the rivers located in this area is the Ventena river, a medium size basin, which displays marked asymmetry both on the left and right sides. The goal of this paper is to examine if in the Ventena basin there is any connection between the intensity of erosion on the different sides of the basin and basin asymmetries or instead they may be related to other factors.
Investigation of the relationships between drainage basin asymmetry, erosive processes supported by other investigations such as satellite imagery observations and field evidences became necessary in order to understand what are the causes responsible for the asymmetries in the Ventena drainage basin.
To study in great detail the basin asymmetry and the intensity of the erosive processes in the sides of the basin two geomorphic indices such as the asymmetry factor (AF) [3,4] and the energy of relief (Er) [5-8] have been calculated and compared.
The asymmetry factor (AF) is used to measure the drainage basin asymmetry and it is defined as AF = 100 (Ar/At), where Ar is the area of the basin to the right of the trunk stream and At is the total area of the drainage basin. For most networks that formed and continue to flow in a stable setting the value of AF should equal to about 50 [4].
The energy of relief (Er) is expressed by the maximum difference in elevation between the highest and lowest point measured in a given area. If it is calculated for single cells of small size this parameter may reveal zones characterized by more or less marked erosion [9,10]. The study of this quantitative index as marker of intensity of erosion was applied by several authors in central Italy, where the meaning of this parameter has been tested through comparative analyses carried out in wide areas and drainage basins of the central Apennines [11,12].
To study in great detail the asymmetry factor (AF) and the relief energy (Er) and their relationship along the entire basin of Ventena river the method of calculating and representing these two geomorphic indices used in previous similarly study [13] was used.
2. Study Area
The Ventena basin (Figure 1) is located on the Adriatic side of northern Apennine in the border area between the Romagna and the Marche regions (central Italy) The Ventena river flows in an almost straight line from west to east with a surface area of around 49 km2. The main river is 24 km long and flows eastward from Monte Tavoleto (425 m.) to the Adriatic Sea. The major axis of the basin is about 17.5 km, while the width ranges from 4.5 to 0.9 km. The basin has a perimeter of about 40.61 km of which 18, 22 km located in the hydrographic left and 22.39 km in the hydrographic right.
The study area is located in the Umbria-Marche-Romagna sector of northern Apennine chain that is characterised by an arcuate shape with a main northeast vergence of asymmetric, thrust-faulted anticlines involving a Mesozoic-Tertiary sedimentary succession [14]. In the foothill area the deformed Umbria-Marche succession is mostly buried beneath recent deposit of Umbria Marche succession (Miocene-Pliocene) [15].
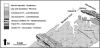
The uppermost sector of the basin is underlain by Mio-Pliocene units of Umbria-Marche succession and it is characterized by the occurrence of a NW-SE trending faulted anticline (the north-western part of Montefiore-Serraungarina ridge), with Oligo-Miocene rocks in its core (Schlier fm) that is crossed transversely by the main stream. The central sector of the basin is underlain by Pliocene units of Umbria-Marche succession, mainly constituted by sands and clays, while in the downstream sector the river before to reach the Adriatic coast flows on Quaternary alluvial deposits (Figure 2).
One of the most interesting features of the Ventena basin is its asymmetry, which reveals a large change of direction and it isn’t influenced by any lithological control or localized climatic conditions. In the upstream zone and also in the central zone the Ventena basin shows a considerably more developed right side. However, in the downstream area, the basin widens and the asymmetry changes. This change is initially gradual, revealing a greater development of the left part of the basin.
3. Method
To make this investigation it was necessary to analyse in detail the relationship between the intensity of erosional processes and the asymmetry running along both sides of the basin.
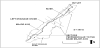
The basin was divided into relatively small sectors that segmented the main axis of the basin, from the outlet to the most distant point of the head-stream, into segments all of 500 m length. Starting from the sides of each segment, lines were created perpendicular to the main axis of the basin, terminating at the left and the right watersheds of the basin. The perpendicular lines created start from the beginning and end of each segment and then enclose a sector (Figure 3).
The AF value of each sector was calculated by using the formula:
AF = 100 (Ar/At)
Where Ar is the area on the hydrographic right and At is the total area of the sector. The AFs of each sector were plotted against distance along the Conca River basin (Figure 4A).
Within each sector, an estimate of Er was obtained by subdividing the area into square cells of 0.25 km2, which were numbered by orthographic coordinates. Within each cell, the Er was calculated using:
Er = highest elevation – lowest elevation
Highest and lowest elevation for each cell were obtained from the existing 1:25 000 topographic map and by referring to the 25 ± 10% m contours. This procedure gave highly detailed data, with 195 Er values for the entire basin. The arithmetic average values of Er for the cells on the hydrographic left and on the right were calculated for each sector. The two values were plotted against distance along the basin (Figure 4B). From here on the term “hydrographic left” and “hydrographic right” will be referred to as “left” and “right”.
4. Results
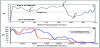
An integrated analysis of AF and Er (Figure 4) shows four major features as outlined below:
- In the upstream sector of the basin, the values of Er are higher on the left side, while the values of AF identified an area of right asymmetry.
- The subsequent zone highlights an area with a distinct right asymmetry. In this area, the asymmetry initially has a slight tendency to the right (AF values next to neutral) (indicated with Arrow No. 1 in Figure 4A) with progressive increasing of AF values toward downstream, reaching a significant value (Arrow No. 2 in Figure 4A) in the central sector of the basin, where AF reached the maximum value for the entire drainage basin (AF = 82). Er in the beginning is higher on the left side than progressively became greater to the right side throughout the following zone. Here, the average values exhibited the largest difference between sides for the entire drainage basin. In this sector the trend of Er and AF toward downstream are opposite In fact, the AF increase toward downstream marking a right asymmetry, while the values of Er highlight a decrease of difference between right and left sides of the basin.
- In the following zone between the end of the central sector and the upper zone of the downstream sector (indicated with Arrow No. 3 in Figure 4A) there is a change in the asymmetry and left asymmetry starts to become predominant. The minimum AF value for the entire drainage basin (AF = 16) occurred in this zone. Er in this zone is always higher on the right maintaining about the same difference of values between left and right sides even in the point where the left asymmetry is greatest.
- In the downstream sector of the basin initially a left asymmetry predominated. Soon afterwards there is a change in the asymmetry and a clear tendency to right asymmetry can be seen. Here, the values of AF increase toward the outlet of the river where the right asymmetry is marked (AF = 75). In this sector of the basin Er values are similar on both sides and are progressively lower toward the zone of the outlet.
5. Discussion and Summary
The data show that a relationship between asymmetry and the intensity of erosion on the opposite sides only occurs in the central zone of the Ventena drainage basin, where the basin asymmetry is right. Even in this sector the asymmetry seems to be unrelated to orientation because the values of Er in the opposite sides and the asymmetry display opposite trends toward downstream. Moreover, where the maximum value of AF that represents the greater right asymmetry in the basin can be observed, the values of Er in opposite sides vary by only about 30% which doesn’t seem enough to account for the strong asymmetry (maximum right asymmetry for the entire basin). In the upstream sectors of the basin, there is no relationship between AF and Er that could be linked to their orientation. In the area indicated by arrow No. 1 (Figure 4A) there is a slightly greater Er on the left, but the AF values highlight the presence of right asymmetry. Similarly, in the area indicated by arrow No. 2 (Figure 4A) the Er values of the opposite sides do not reveal any differences significant enough to justify such a strong asymmetry. In the zone at the end of the central sector of the basin, there is a persistent, although progressively diminishing right asymmetry, even if Er values are always greater on the right.
In the downstream sector of the basin, the area indicated by arrow No. 3 (Figure 4A) shows a left asymmetry with corresponding higher Er on the right. Following this, Er values are the same on the opposite sides until the end of the basin; there is a corresponding change in asymmetry to the right with values that increase progressively until the mouth of the river.
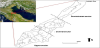
The analysis of the satellite imagery of this area (Figure 5A) shows a strong relationship between the course of the Ventena river and lineaments detectable from satellite images. The data also show that the drainage pattern is strongly influenced and controlled by lineaments.
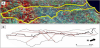
In the upper, central and partially in the lower sectors of the basin the main course of the river flows along directions that coincide with those of the lineaments detectable from satellite images (Figure 5B) suggesting that the course of the river is controlled by faults.
The analysis performed in this study suggests the following conclusions:
- In the Ventena drainage basin there is no direct relationship between asymmetry and intensity of erosion of both sides, caused by their orientation. With regard to the asymmetries present in the upper and lower sectors of the basin, our findings exclude that they may be the result of the greater intensity of erosion on the basin sides. The asymmetries seem to be due to different causes (probably the neotectonic movements) instead of orientation which may have had a marginal role.
- Other investigations based on remote sensing analysis seem to confirm the results obtained through the analysis made of the two geomorphic indices. Observations based on satellite imagery show that the course of the main stream is strongly related to lineaments. In particular, the lineaments observed by satellite images seem to control strongly the development and the emplacement of the main stream. The structural control of the course of the Ventena River appears to be imposed from below. The lineaments observed appear to represent the surface expression of buried fractures. The structural control of the main stream might be due to under printing, to the transmission of structures located under the surface into the sequence above.
- It can be useful to apply this kind of study to all drainage basins of the Marche-Romagna regions to understand the true role of orientation factor in the morphological arrangement of the area.
Competing Interests
The author declare that there is no competing interests regarding the publication of this article.