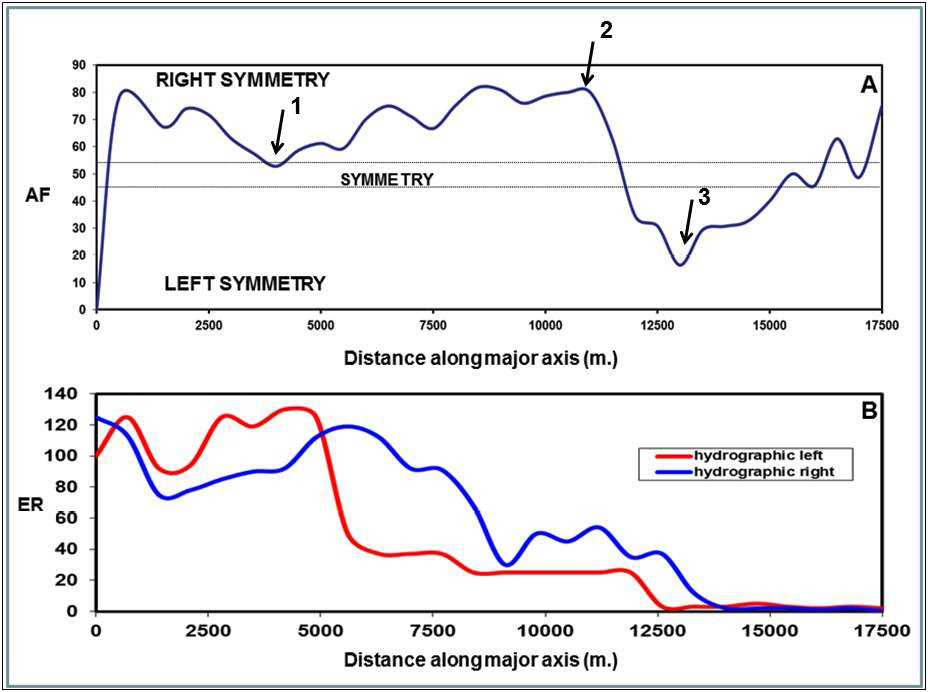
Figure 4:
(A) asymmetry factor (AF) value plotted against distance along Ventena river basin; (B) energy relief (Er) average values on the hydrographic left and on the right plotted against distance along Ventena river basin.