


1. Introduction
Approximately 50% of world’s population live in urban areas, a number which is expected to increase to nearly 60% by 2030. High levels of urbanisation are even more evident in Europe where today over 70% of Europeans live in urban areas, with projections that this will increase to nearly 80% by 2030 [1,2,3].
Urbanisation and its associated socio-economic and environmental impacts is one of the key drivers of change that challenges the sustainability and resilience of urban environments globally, placing significant pressure to citizens and reducing urban security [3,4,5,6].
The increasing urbanization of cities projected for the coming decades [1,2] is an important concern for energy security [7,8,9], as air and surface temperatures are expected to increase further and the urban heat island strength to be intensified [10, 11]. To this end, the analysis of the thermal environment in cities is important for thermal resilience plans [2]. Furthermore studies show that climate change influence the temperature field in cities [12,13,14,15] and consequently results in increased energy consumption and poor city energy efficiency [16,17]. High temperatures in cities are also considered endangering factors for urban health [18,19].
Urbanization is considered a city problem to be addressed by cities turning smart. The basis of the idea is the need to coordinate and integrate products that have been developed separately from one another but have clear synergies, especially in the field of urban climate. To this end and in order to create an intelligent, technological, interconnected and dynamic system, it is essential to have high capacity for analysis, synthesis and integration of the huge amount of data produced by different sources, including earth observation [20]. The latter supports the temporal and spatial knowledge of the urban territory by means of city sensing and city modeling. City sensing integrates data with varying spatial and temporal dimensions in near real time acquisition processes, whereas city modeling allows the extraction of information on the state of urban environment, in particular as this is influenced by urbanization.
2. Methodology
Step 1: Selection of the study area
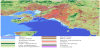
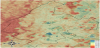
For the purposes of this paper, the area of the wider Urban Agglomeration of Athens is examined (hereinafter referred to as UAA), with emphasis given to the City of Athens (subset of the overall urban agglomeration of Athens; hereinafter referred to as CA) (Figure 1). In particular, UAA has a population of 3.181.872 inhabitants [21], covers an area of 462 km2 and includes 41 Municipalities. CA has a population of 664.046 inhabitants (Census, 2011), covers an area of 39 km2 and reflects a multitude of land cover types, with the type “urban fabric” clearly dominating. In both UAA and CA, environmental pressures are related to increased urban building and population density, lack of green areas, aged building stock, intense anthropogenic heat sources (predominantly transport) and increased levels of aerosols.

Step 2: Background information on the state of the built environment in the study area
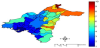
Figures 2a and 2b provide important information on the built environment for UAA and CA. In particular Figure 2a presents the average age of the building stock in years; it can be seen that CA reflects building ages above 45 years old, a fact which leads to poor energy performance of the building stock, increased heat release to the open environment and poor indoor and outdoor thermal comfort conditions. In Figure 2b, the average number of storeys per building is provided. Higher buildings are recognized in CA, a fact which may affect the local circulation patterns and potentially trap air masses (and heat) close to the ground. Finally, Figure 2c presents the population density for the study areas (normalized in the scale 1-10, from higher to lower densities respectively). Such information is considered important for the assessment of urban pressures. It can be seen that CA reflects a rather high population density.
Step 3: Supervised classification of land cover for the study area.
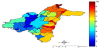
The classification as applied for eleven classes (Figure 3) and based on the use of Landsat data in the visible part of the spectrum (spatial resolution 30 m), is considered necessary in order to link the state of the thermal environment with the type of land cover. An aggregate assessment of the green areas is provided in Figure 4 (normalized in the scale 1-10; 1 lowest and 10 highest presence of green areas).
Step 4. Assessment of the thermal environment in the study areas (summer period) through the estimation of Land Surface Temperature (LST) zone statistics analysis for the study areas
LST is probably the most direct manifestation of the urban thermal environment [22]. In addition to ground measurements, LST may be also estimated with the use of satellite data in the thermal infrared part of the electromagnetic spectrum [23], a fact which takes advantage of the high spatial resolution of the satellite sensor. In this study, the methodology to estimate LSTs in the City of Athens, is based on the use of Landsat satellite data (of harmonized spatial resolution 120 m) during summer, for days with similar synoptic conditions. For the estimation of LST, a mathematical equation was used [24] relating LST to radiance and emissivity (see Eq. 1). It is a generalized singlechannel method in order to retrieve LST from only one thermal channel:
LST= γ [ε-1 (ψ1 Ls + ψ2) + ψ3] + δ
where Ls is the at-sensor radiance, ε is the surface emissivity, γ and δ are two parameters dependent on the Planck’s function, ψ1 is the reverse of the atmospheric transmissivity (1/τ), ψ2 depends on the upwelling and down-welling atmospheric radiances and ψ3 equals the down-welling atmospheric radiance.
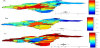
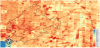
For demonstration purposes, the spatial differentiation of the aggregate LSTs (normalized in the scale 1-10; 1 and 10 refer to higher and lower LSTs respectively) in the study areas for the same time period as in Steps 2 and 3, is provided in Figure 5. It can be seen that LSTs in CA fall in the scale from 4 to 5.
Step 5: Identification of hot spots in the city of Athens.
For the purposes of this study and in order to develop a quantitative view for the thermal environment in UAA, analysis of Landsat LST images was performed in order to detect areas (pixels) in the city which consistently appeared to have the highest LSTs. These areas (pixels) were termed as “Hot spots”, whereas the manual interpretation of the respective Landsat LST images showed that LST exceeded 44˚C which was thereafter considered as a local threshold for the analysis of other LST images for the same area. It yields that as the above local threshold value depends strongly on land cover, the presence and strength of anthropogenic heat sources, its direct application to other urban areas, without being adjusted, may result in misleading results.
Hot spots are recognized (Figure 6) in areas to the west of CA, in the border with Municipalities characterized by limited green cover and poor building stock. On the contrary, lower LSTs are found in areas to the east and southeast of CA, in the border with Municipalities with higher green cover and better building stock.
It should be mentioned that a limitation in the use of Landsat TM data for the estimation of LSTs is the revisit time of 16 days. A way to overcome this limitation is to use MODIS data with a revisit time of few hours, downscaled to the spatial resolution of Landsat TM data (Figure 7) through the employment of the Pixel Block Intensity Modulation (PBIM) method [25, 26]. According to this method:
where:
LSTMODIS DOWNSCALED refers to the estimated image with the same
spatial resolution as Landsat TM in the thermal infrared,
LSTMODIS refers to the initial MODIS image,
LSTLANDSAT refers to the original Landsat image and,
LSTLANDSAT MEAN is the mean value of LST in an area of 1 km x 1km,
that is of the same size as in MODIS.
In this method, a Landsat LST image taken on a date during the same seasonal period at which the MODIS LST image was acquired is used as a scaling factor in the PBIM method. For example, if downscaling is applied to a July MODIS LST image, a Landsat LST image obtained during the summer period (June, July or August) should be used in order to derive MODIS LST with higher spatial resolution. Given that the regional LST spatial distribution and variation is greatly related to heating from solar radiation and the physical properties of the land surface itself, the potential of using as a scaling factor a highresolution LST image that is season-coincident and not necessarily time-coincident with the low-resolution LST image is considered.
However, there are a number of prerequisites for selecting a proper Landsat LST image as a scaling factor:
- No significant changes in land cover and land use should be observed over the test site during the period between the acquisition dates of the Landsat LST and MODIS LST image.
- Both Landsat LST and MODIS LST images should correspond to similar synoptic and weather conditions (cloudiness, mean daily air temperature and relative humidity, rainfall).
- The Landsat LST and MODIS LST images should correspond to the same season period so that there are no significant variations in the solar height.
Despite the fact that the downscaling technique underestimates LSTs by roughly 2-3°C, it is considered a valuable tool for depicting discontinuities in the thermal environment as well as areas with consistently higher LSTs.
3. Conclusion
Results of this study demonstrate the close interlinks between urbanization, the built environment and the thermal environment in cities. A thorough study of these interlinks is considered necessary for assessing the state of the thermal environment at the city scale. For instance the link of the age of buildings to the distribution of LSTs is recognized and linked to population density, land cover, presence of green areas, etc.
In terms of the thermal environment, the potential of Earth observation to map LSTs at the district level is recognized, a fact which supports the recognition of hot spots, i.e. areas in the city which consistently present higher LSTs and are thus considered causes for increased energy consumption and dangers to human health. Limitations in terms of the temporal resolution of high spatial resolution Earth observation data may be circumvented by means of downscaling techniques which improve the medium spatial resolution of high temporal resolution EO data while preserving their radiometric content.
Results are also supportive of urban planning strategies to the direction of smart and sustainable urbanization. Such planning strategies can reduce a city‘s vulnerability to urbanization by directing new development away from areas at greatest (thermal) risk, by adopting land use practices that mitigate local climate change impacts and by promoting regeneration measures in view of improving the building stock, as well as its energy performance.
Finally they also demonstrate the importance to coordinate and integrate products that have been developed separately from one another but have clear synergies, especially in the field of urban climate. It should be mentioned that the application presented in this study, is of demonstration character which implies that the drafting and assessment of the planning strategies need to be based in more detailed spatial and temporal calculations of the energy fluxes and the state of the thermal environment in the area under investigation.
Acknowledgments
Part of this paper was prepared in the framework of the project MONITOR (ESA-MOST DRAGON Programme).