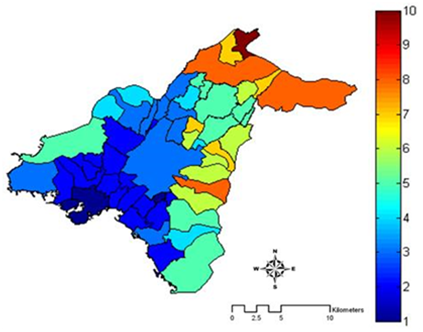
Figure 4:
Aggregate assessment of the presence of green areas in the study areas (normalized in the scale 1-10; lower to higher presence of green areas respectively).